0

I haven't found a tool/plugin that could do this, but I am almost there. Here is what I want to do:

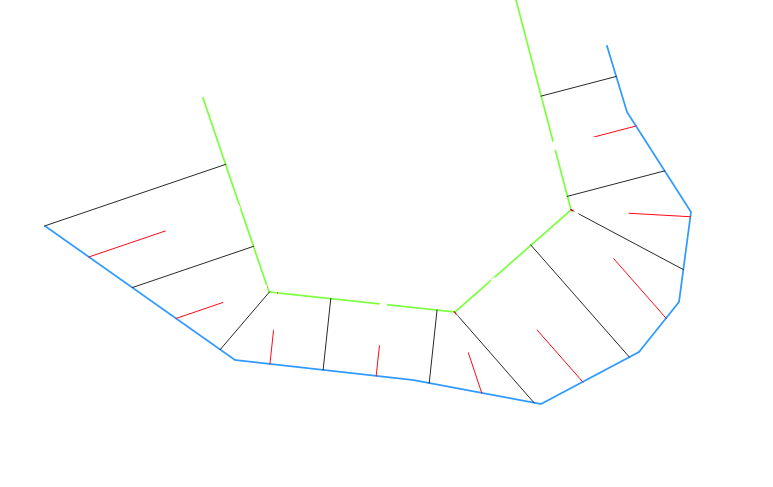
enter image description here

I want to create a slope like the ones from CAD programs, but I don't have and don't need a DEM. It's just for the visualization of the slope.

What I did so far:

  1. Create 2 line layers for the upper slope (blue) and the lower slope (green)
  2. The Tool "Points along geometry" is creating 2 point layers. 1 layer has points every 6 meters, the other one has points every 6 meters with an offset of 3.
  3. With shortest_line($geometry, aggregate('testline', 'collect', $geometry))

on both point layers, I am able to create lines from one point to the lower slope line, so it looks like a connection of both slope lines.

I need every second line to be half as long. How can I do that?

Can I change the length of the "shortest_line"?

I tried to multiply with 0.5 and other things, but nothing worked so far.

Is there an alternative function?

Should I try something with "make_line", some points and angles?

I am not really good when it comes to coding in QGIS.

1 Answer 1

2

You can use this expression to generate a line with a length of 50% using the following expression - replace *0.5 at the 7th last line with any percentage you like:

with_variable (
    'varinter',
    intersection (
            extend (
                shortest_line(
                    $geometry, 
                    aggregate (
                        'testline', 
                        'collect', 
                        $geometry
                    )
                ),
                1,
                1
            ),
            aggregate(
                'testline', 
                'collect', 
                $geometry
            )
        ),

make_line (
    $geometry, 
    project (
        $geometry, 
        length (
    make_line (
        $geometry, 
        @varinter
    )   
)
*0.5,
        azimuth (
            $geometry, 
            @varinter
        )
    )
))

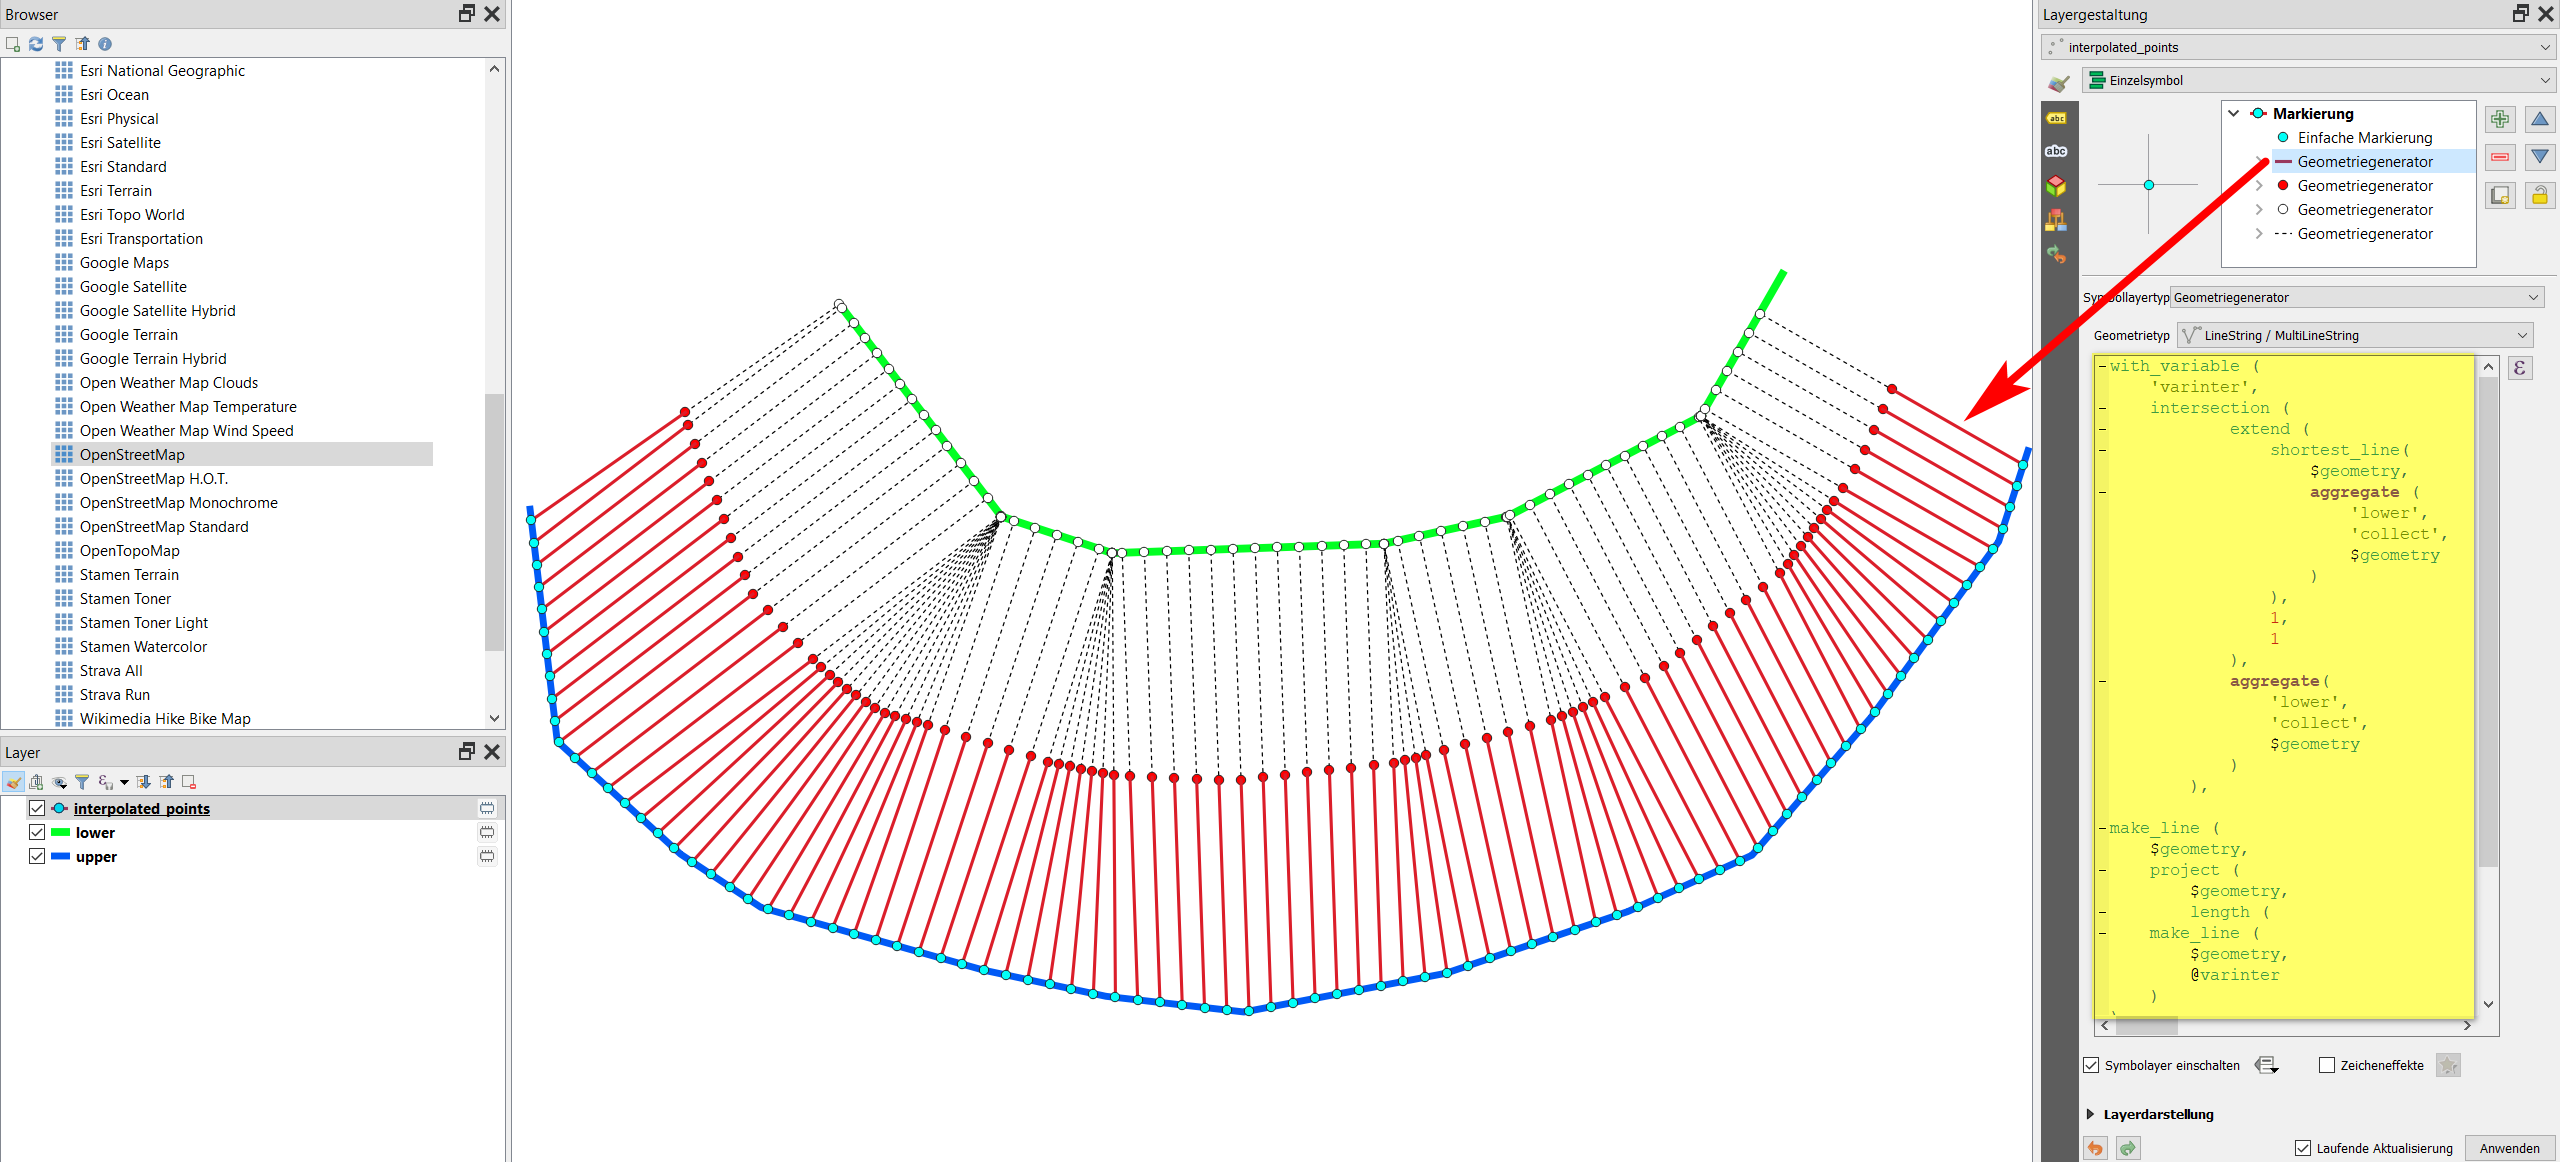
What it does: it takes the lines you created (dotted black line), finds the intersection with the lower slope and creates a point where the lines cross (white dots). You have to extend the lines a bit, as sometimes no intersection is created.

You than can measure the angle (azimuth) between the points on the upper (blue dots) and the lower slope line (white dots) - basically its the angle of the line you already created - but, as can't directly measure the angle of the line, you have to do it using two points.

Than, you can create a new point (red dots), using project to project the point on the upper slope ($geometry) for a certain distance (the length of the whole black dotted line *0.5) in a certain azimuth: the angle calculated before. Finally, connect the point on the upper slope (again $geometry, blue dots) with this newly created point (red dots) and you get the red lines.

enter image description here

0

Your Answer

By clicking “Post Your Answer”, you agree to our terms of service and acknowledge you have read our privacy policy.

Not the answer you're looking for? Browse other questions tagged or ask your own question.