0

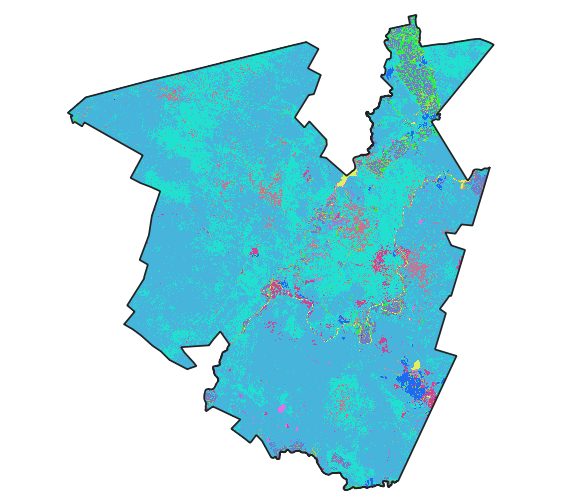
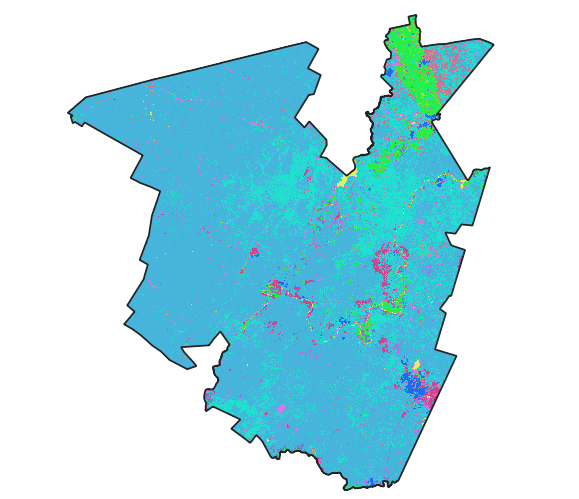
Using QGIS, I am trying to calculate the land use change of 35 classes/values between two raster layers (1990 and 2013) for the same area.

1990
19901

2013

enter image description here

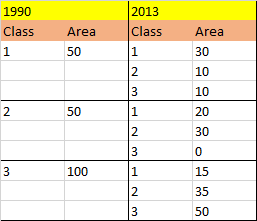
The output I am trying to achieve is a table that shows the original area/pixels of each 1990 class, and the change to each of the 35 classes for the 2013 layer.

What tool/process could I use for this?

For a simple example using 3 classes:

enter image description here

1
  • As per help center please do not include chit chat like thanks in your posts.
    – PolyGeo
    Commented Aug 15, 2021 at 21:34

1 Answer 1

1

You need QGIS, a bit of Excel, and Group Stats plug-in to be able to get your preferred results. This solution requires changing the raster data to vector. It might be a bit computationally heavy depending on your raster file size so be careful. QGIS crashes a lot during such processes.

  1. First you need to polygonise the 1990 raster. You can use either Polygonize or Raster pixels to polygons. This will converts every raster cell to polygon.

  2. This is more of 1B you can dissolve the results based on their values to make your polygons bigger and reduce the count of spatial join cross matches that comes in next steps. Just use Dissolve on polygonised layer and select their value filed. After that use Multipart to singleparts to reduce the complexity of your polygons.

  3. convert 2013 raster data to points using Raster pixels to points.

  4. Use Join attributes by location. Put the points as Base layer and the polygons as join layer. Set geometric prediction on intersects and join type one-to-many. Result will be a point layer of year 2013 that has a column for its previous land-use

  5. Open group stats from Vector > Group Stats > Group Stats. This plug-in works like Excel pivot-table. Select the joined layer. Here you need to put the joined polygon values (raster 1990 values) as rows. Then put values of 2013 as columns AND values. Then put count in values. Your result is a table that shows the count of cells of each land-use 2013 for the land-use in 1990.

  6. Export the table to CSV and load it in excel.

  7. Multiply all values by the area of cells in 2013. You have the area of each 2013 land-use for each category land-use of 1990.

  8. Sum each row and you will have the area of each land-use category of 1990.

Again I emphasis that these operations are computationally heavy. It is better to use Python or R for such operation.

Your Answer

By clicking “Post Your Answer”, you agree to our terms of service and acknowledge you have read our privacy policy.

Not the answer you're looking for? Browse other questions tagged or ask your own question.