I'm trying to 1) define a square-ish boundary on a map and 2) divide that shape into a grid consisting of 1-square-mile chunks. I'm doing this because I have a dataset of people's lat/long coordinates and another dataset of business lat/long coords and am looking to simplify the calculation of distances to certain businesses for each individual (so, grouping individuals into 1-square-mile grids as opposed to treating each one individually).
Regarding 1), I've defined the four points creating my "square" below: nw_point, sw_point, ne_point, and se_point.
Regarding 2), I start at nw_point and have been trying to increment latitude and longitude appropriately to make each grid piece. I'm using a formula from this answer to build a square bounding box around each lat/long point, but am running into issues around certain latitudes. See the results corresponding to box_id 45 at the bottom – the calculated longitudinal values seem much higher than the points/boxes preceding, and this is confirmed visually, as I've been plotting the points using this website. So I'm not sure if I'm just mis-using the website, misunderstanding the type of projection being used, or whether I'm going about this grid calculation in a technically wrong way.
import numpy as np

def add_latitude(lat, mi = 1):
    modifier = mi / 69
    return lat - modifier, lat + modifier

def add_longitude(lat, long, mi = 1):
    modifier = mi / 69 / np.cos(lat)
    return long - modifier, long + modifier

def bounding_coords(lat, long, mi = 1):
    southernmost_lat, northernmost_lat = add_latitude(lat, mi = mi)
    westernmost_long, easternmost_long = add_longitude(lat, long, mi = mi)
    sw_point = (southernmost_lat, westernmost_long)
    nw_point = (northernmost_lat, westernmost_long)
    ne_point = (northernmost_lat, easternmost_long)
    se_point = (southernmost_lat, easternmost_long)
    return sw_point, nw_point, ne_point, se_point

def format_points_for_website(points, color = 'red', label = ''):
    return '\n'.join(f'{p[0]},{p[1]},{color},marker,"{label}"' for p in points)

# Start with handling the contiguous United States,
# by picking maximal lat/longs that completely bound the lower 48
# https://en.wikipedia.org/wiki/List_of_extreme_points_of_the_United_States
# Northwest Angle Inlet, MN
continental_northernmost_lat = 49.38293539482664
# Ballast Key, FL
continental_southernmost_lat = 24.52108687199902
# Bodelteh Islands, WA
continental_westernmost_long = -124.76410018717496
# Sail Rock, Lubec, ME
continental_easternmost_long = -66.94700844863216
nw_point = (continental_northernmost_lat, continental_westernmost_long)
sw_point = (continental_southernmost_lat, continental_westernmost_long)
ne_point = (continental_northernmost_lat, continental_easternmost_long)
se_point = (continental_southernmost_lat, continental_easternmost_long)

# Starting at northwesternmost point above, begin building out "chunks" of land.
# You could technically start at any of the four points, but we'll start with this one.
# Start by traversing land until we've passed the southernmost point, then increment to the east
# and start all over again until we've traversed to the easternmost point.
curr_long = nw_point[1]
begin_lat, begin_long = nw_point
boxes = {}
box_id = 0
colors = ['red', 'green', 'blue', 'purple', 'orange']
points = []
# Until we've passed the easternmost continental longitude
while curr_long < continental_easternmost_long:
    # And until we've passed the southernmost latitude
    curr_lat = begin_lat
    while curr_lat > continental_southernmost_lat:
        if box_id == 46:raise
        # First or 0th element represents a numerically lower latitude, which we need to
        # use, since latitude increases the further north you go, and we're building from northwest to southeast
        curr_lat = add_latitude(curr_lat)[0]
        # Get lower latitude boundary for use in centroid of "next" bounding box
        lower_lat = add_latitude(curr_lat)[0]
        print(f'Center point: ({lower_lat}, {curr_long})')
        sw_point, nw_point, ne_point, se_point = bounding_coords(lower_lat, curr_long)
        print(format_points_for_website([sw_point, nw_point, ne_point, se_point], color = colors[box_id % len(colors)], label = box_id))
        # Could use a more informative box ID to perhaps represent common lat/long
        # boundaries across different boxes, but this suffices for now...
        box_id += 1
    # Use second element (numerically greater)
    curr_long = add_longitude(curr_lat, curr_long)[1]
Relevant output provided below:
...
Center point: (48.7307614817832, -124.76410018717496)
48.71626872816001,-125.16592296075729,purple,marker,"43"
48.745254235406385,-125.16592296075729,purple,marker,"43"
48.745254235406385,-124.36227741359264,purple,marker,"43"
48.71626872816001,-124.36227741359264,purple,marker,"43"
Center point: (48.71626872816001, -124.76410018717496)
48.70177597453682,-125.43565414695419,orange,marker,"44"
48.7307614817832,-125.43565414695419,orange,marker,"44"
48.7307614817832,-124.09254622739573,orange,marker,"44"
48.70177597453682,-124.09254622739573,orange,marker,"44"
Center point: (48.70177597453682, -124.76410018717496)
48.687283220913635,-126.80827425555613,red,marker,"45"   ***
48.71626872816001,-126.80827425555613,red,marker,"45"   ***
48.71626872816001,-122.7199261187938,red,marker,"45"   ***
48.687283220913635,-122.7199261187938,red,marker,"45"   ***


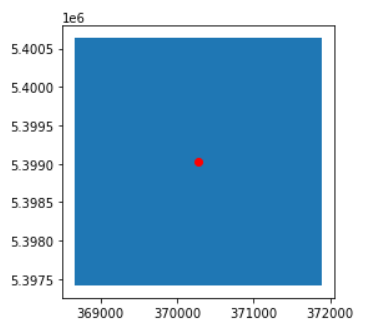
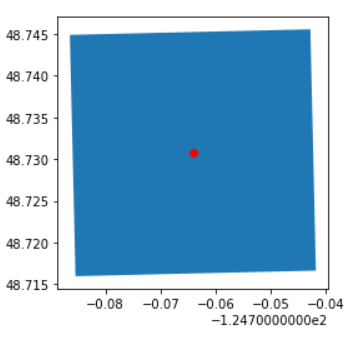
shapelygeometries in combination withgeopandas, so you can project points in a certain region to a metric CRS. Once you have that, you can easily obtain square bounding boxes and divide them into equal parts.