0

I am using two GeoTIFFs to calculate NDVI.

Relating to bands 5 and 4 of Landsat 8, and using the raster calculator in QGIS, I import the TIFFs and use the formula (B5-B4)/(B5+B4).

The projection for the source TIFFs is EPSG:32611 - WGS 84 / UTM zone 11N The output file shares the same CRS.

The output GeoTIFF does not seem to reflect the same CRS, though, and calculates values beyond the bounds of the original data which creates extreme values (see screenshot).

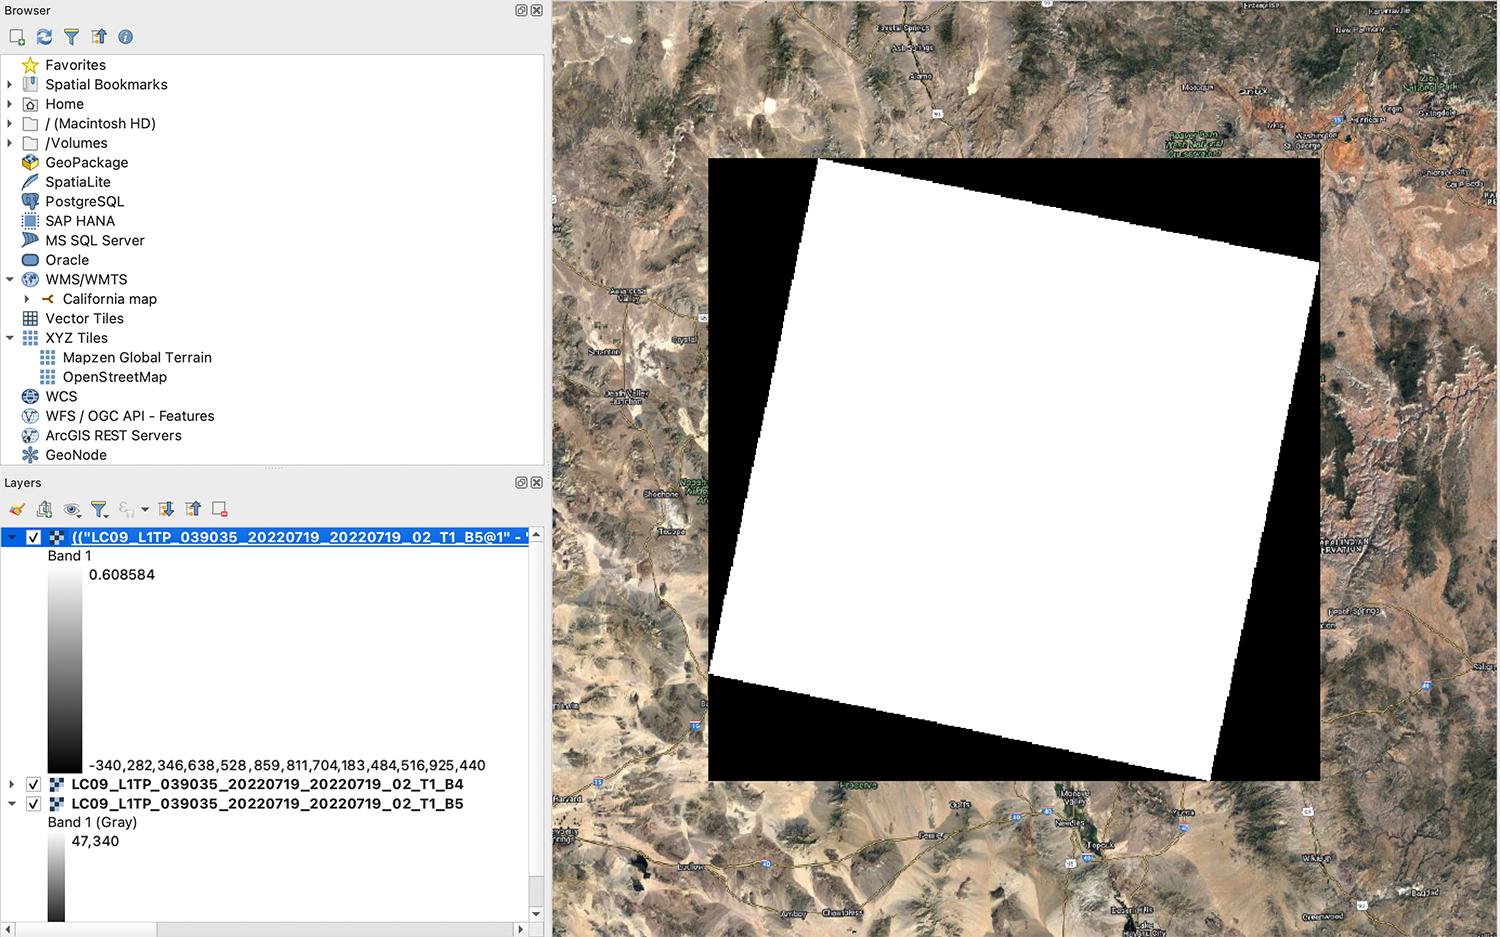
What am I doing wrong?enter image description here

1 Answer 1

1

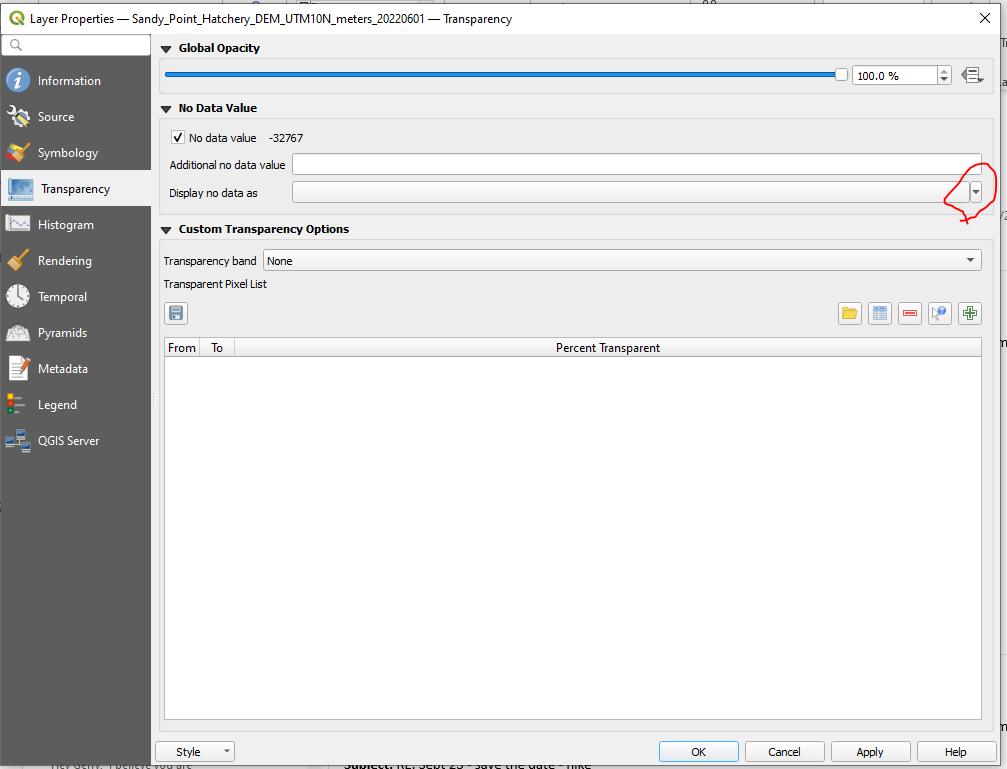
The areas shown in black are the NoData values of the raster. To hide the NoData values from the display you can go into Layer Properties-Transparancy. From the Display no data as drop-down you will see a checkbox for No Color. Check that and hit the Apply button. The black areas will disappear from the display.

enter image description here

3
  • Thanks for this. The no data field is actually greyed-out when I do this, and I'm also not sure that it resolves the underlying problem. I want to find min/max values of calculated NDVI - if I'm only hiding the display of extreme values rather than removing or preventing them in the first place, I still can't do this. Commented Oct 7, 2022 at 9:22
  • I'm also not clear why it creates that specific bounding box and fills those areas with no data - why is the projection changing? Commented Oct 7, 2022 at 9:23
  • 1
    As shown your nodata value is -32767. This will be ignored in any statistical calculations. If you want to determine the min and max value areas in a raster you should post a new question.
    – GBG
    Commented Oct 7, 2022 at 14:47

Your Answer

By clicking “Post Your Answer”, you agree to our terms of service and acknowledge you have read our privacy policy.

Not the answer you're looking for? Browse other questions tagged or ask your own question.