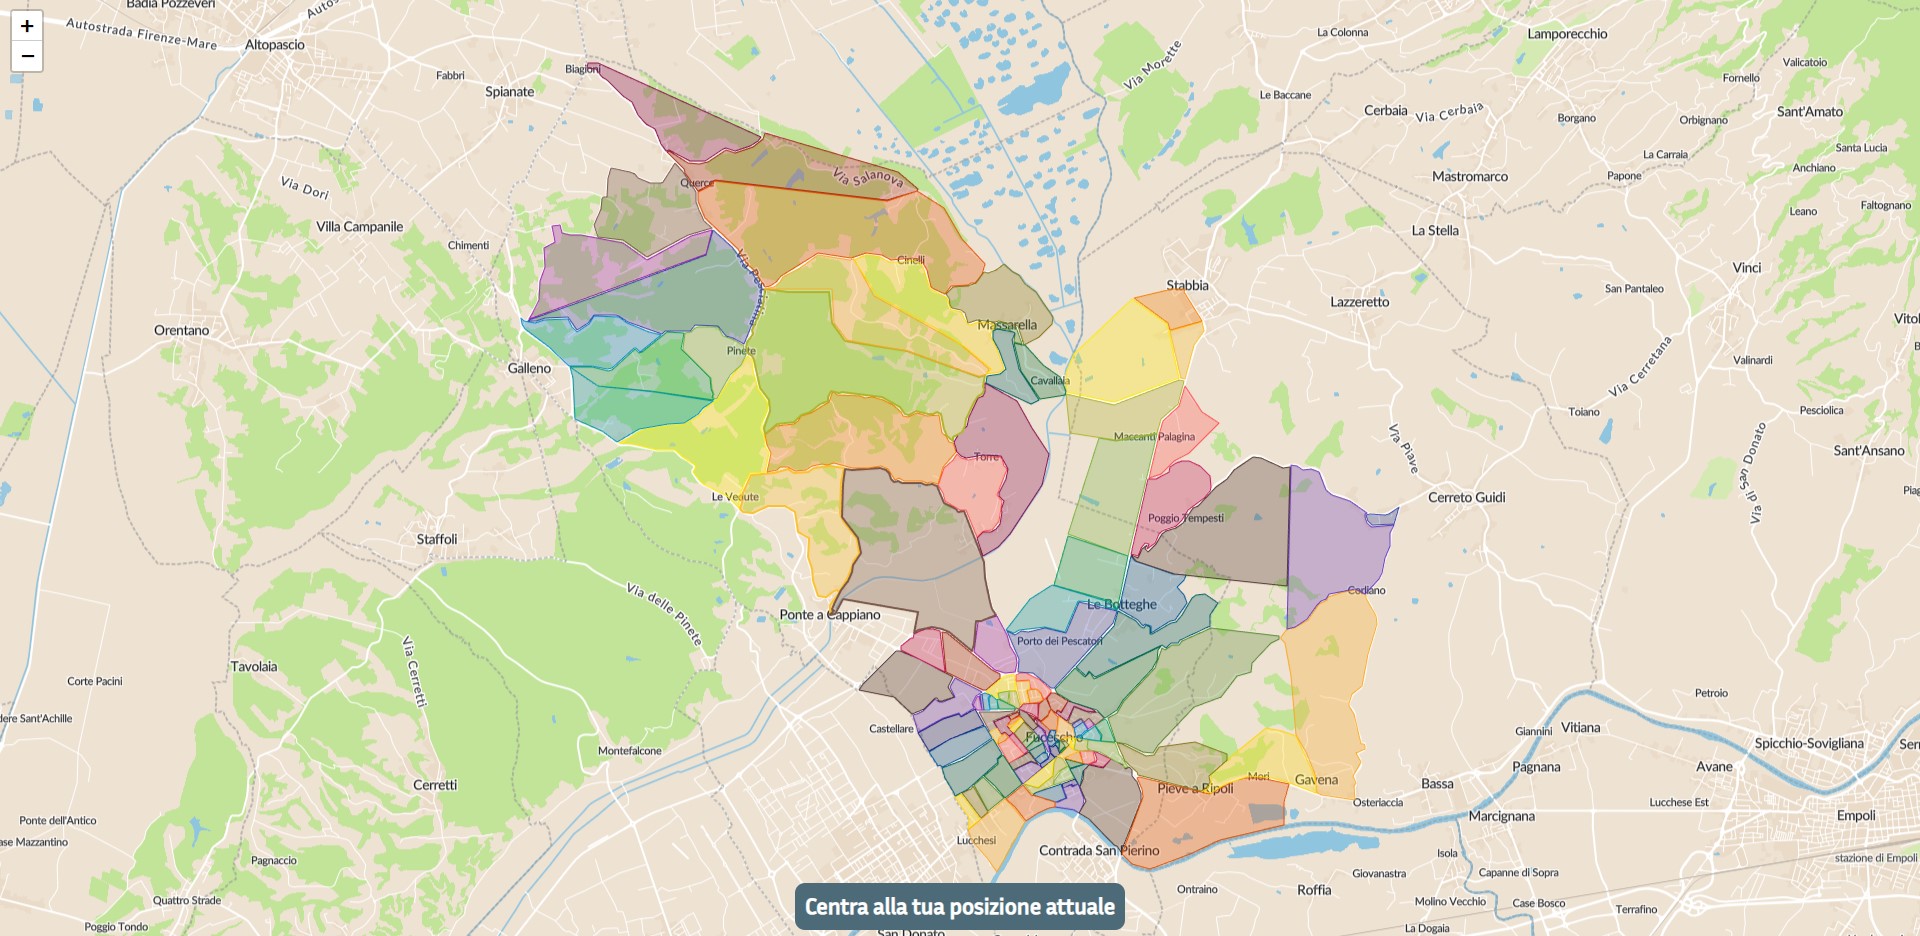
I have a KML file which I need to import in a map using Leaflet. If I use leaflet-kml I can see all polygons with color set from KML file.
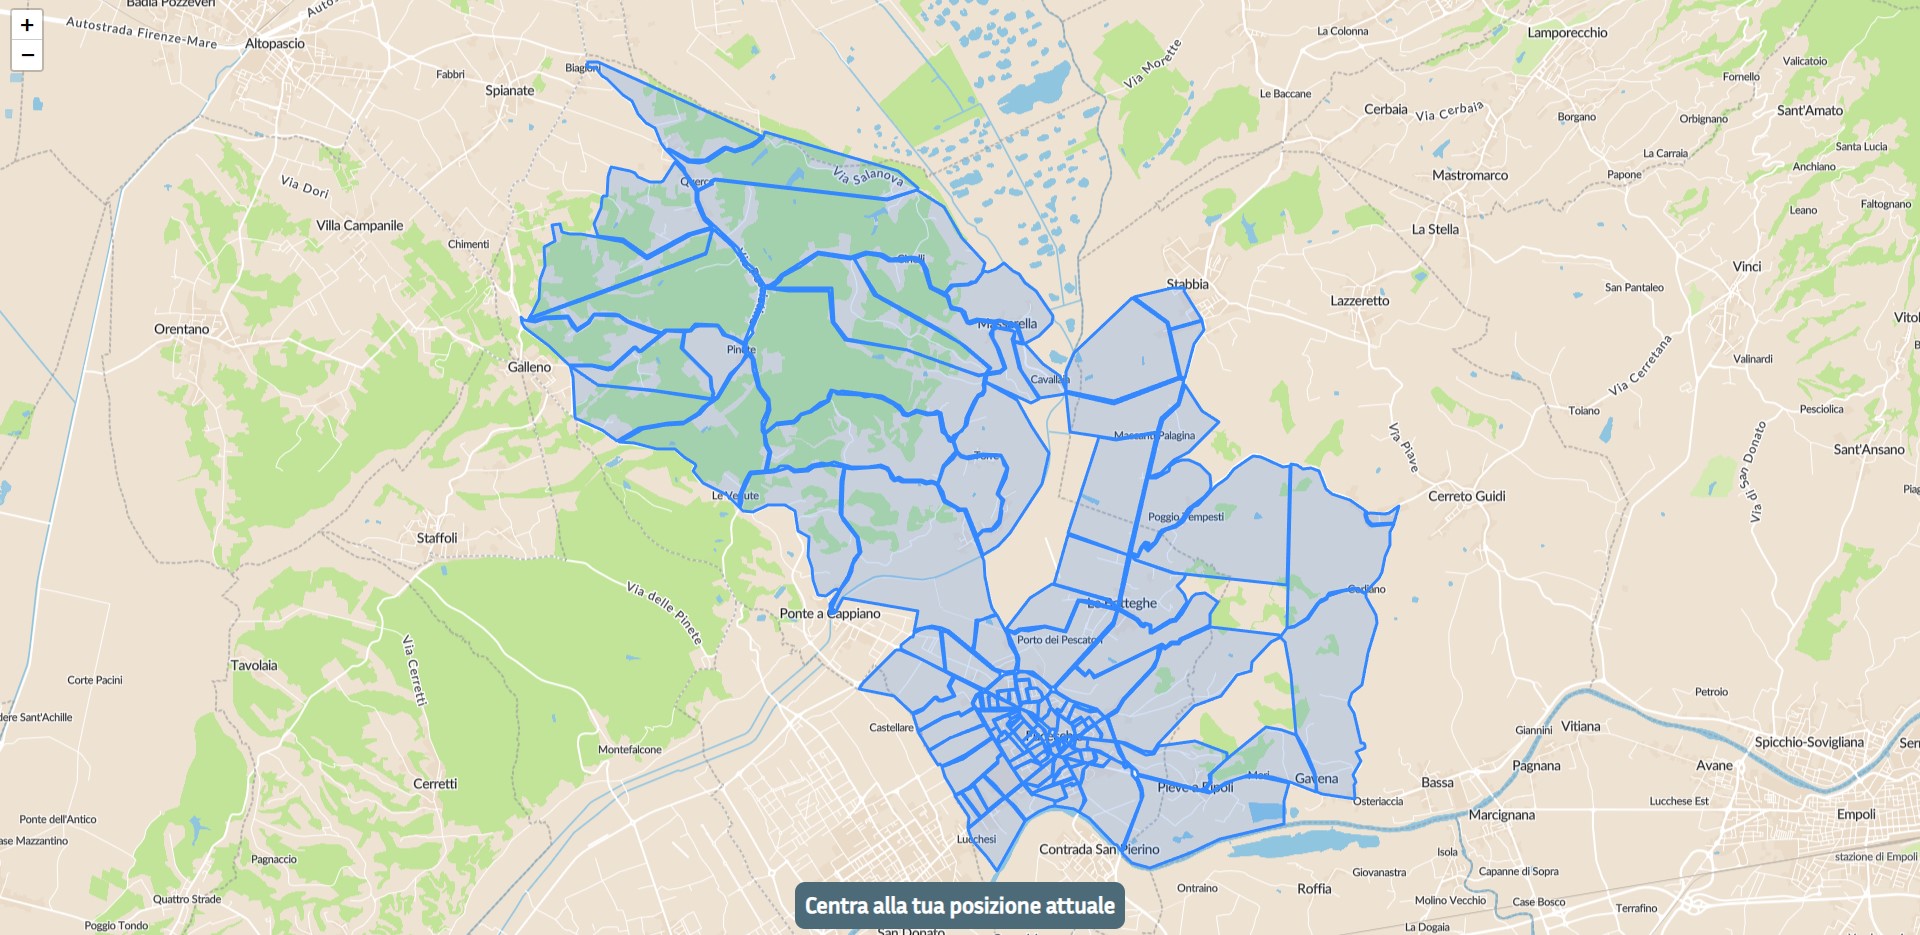
But because I need to show only one polygon extracted for this file, in another question, someone suggests to use leaflet-omnivore which allow me to do that. In this way, for some reason, can't read the style in KML and use the blue for all polygons.
This is the map loaded with leaflet-kml with colors set by the KML file:
And the code with leaflet-kml:
    <script type="text/javascript">
            // Make basemap
        const key = 'xxx';
        const map = L.map('map').setView([0, 0], 1);
        const gl = L.maplibreGL({
            style: `https://api.maptiler.com/maps/1cc7120b-9404-449d-8aca-dfcde7b44b89/style.json?key=${key}`
        }).addTo(map);

        map.attributionControl.setPrefix('');

            // Load kml file
            fetch('doc.kml')
                .then(res => res.text())
                .then(kmltext => {
                    // Create new kml overlay
                    const parser = new DOMParser();
                    const kml = parser.parseFromString(kmltext, 'text/xml');
                    const track = new L.KML(kml);
                    map.addLayer(track);

                    // Adjust map to show the kml
                    const bounds = track.getBounds();
                    map.fitBounds(bounds);
                });
    </script>
This is the map loaded with leaflet-omnivore:
And the code with leaflet-omnivore:
    <script type="text/javascript">
            // Make basemap
        const key = 'xxx';
        const map = L.map('map').setView([0, 0], 1);
        const gl = L.maplibreGL({
            style: `https://api.maptiler.com/maps/1cc7120b-9404-449d-8aca-dfcde7b44b89/style.json?key=${key}`
        }).addTo(map);

        map.attributionControl.setPrefix('');

            // Load kml file
            var geoJsonLayer = L.geoJSON(null, {
            // Filter desidered number
            //  filter: function(feature) {
            //    return(feature.properties.name == 'Territorio 050');
            //  },
              onEachFeature: function(feature, layer) {
                if (feature.properties.name) {
                  layer.bindPopup(feature.properties.name);
                }
              }
            });

            var kmlLayer = omnivore.kml('doc.kml', null, geoJsonLayer)
              .on('ready', function() {
                map.fitBounds(kmlLayer.getBounds());
              })
              .addTo(map);
    </script>
The KML file:
<?xml version="1.0" encoding="UTF-8"?>
<kml xmlns="http://www.opengis.net/kml/2.2">
  <Document>
    <name>Nuova Mappa Residenziale</name>
    <description/>
    <Style id="poly-006064-1000-77-nodesc-highlight">
      <LineStyle>
        <color>ff646000</color>
        <width>1.5</width>
      </LineStyle>
      <PolyStyle>
        <color>4d646000</color>
        <fill>1</fill>
        <outline>1</outline>
      </PolyStyle>
      <BalloonStyle>
        <text><![CDATA[<h3>$[name]</h3>]]></text>
      </BalloonStyle>
    </Style>
    ...
    <StyleMap id="poly-006064-1000-77-nodesc">
      <Pair>
        <key>normal</key>
        <styleUrl>#poly-006064-1000-77-nodesc-normal</styleUrl>
      </Pair>
      <Pair>
        <key>highlight</key>
        <styleUrl>#poly-006064-1000-77-nodesc-highlight</styleUrl>
      </Pair>
    </StyleMap>
    <Folder>
      <name>Fucecchio Alto 001-014</name>
      <Placemark>
        <name>Territorio 001</name>
        <styleUrl>#poly-880E4F-1000-77-nodesc</styleUrl>
        <Polygon>
          <outerBoundaryIs>
            <LinearRing>
              <tessellate>1</tessellate>
              <coordinates>
                10.80684,43.72934,0
                ...
              </coordinates>
            </LinearRing>
          </outerBoundaryIs>
        </Polygon>
      </Placemark>
      <Placemark>
        <name>Territorio 002</name>
        <styleUrl>#poly-A52714-1000-77-nodesc</styleUrl>
        <Polygon>
          <outerBoundaryIs>
            <LinearRing>
              <tessellate>1</tessellate>
              <coordinates>
                10.806808,43.734096,0
                ...
              </coordinates>
            </LinearRing>
          </outerBoundaryIs>
        </Polygon>
      </Placemark>
    </Folder>
    <Folder>
      <name>Fucecchio Nord 015-025</name>
      <Placemark>
        <name>Territorio 015</name>
        <styleUrl>#poly-FF5252-1000-77-nodesc</styleUrl>
        <Polygon>
          <outerBoundaryIs>
            <LinearRing>
              <tessellate>1</tessellate>
              <coordinates>
                10.801615,43.736216,0
                ...
              </coordinates>
            </LinearRing>
          </outerBoundaryIs>
        </Polygon>
      </Placemark>
Full KML file: https://pastebin.com/LuNLcArN
There is a way to read the color from file and show it like leaflet-kml?


