0

I have some polygons, say, TIGER counties, or hexagons, or what have you. I also have point data that I would like to aggregate over those polygons.

I will be displaying this data on a web map, so ESPG:3857. However, it makes the most sense to me to aggregate my data in a "geographic" mode, e.g. ESPG:4326, because this keeps the edges of my polygons "straight" in a great-circle sense. This raises an issue, though, where the polygon that I've aggregated over and the one that I display to users will not be the same polygon: the edges in my ESPG:3857 projection are not the same edges from my ESPG:4326 projection. I could aggregate in ESPG:3857, but then the polygons that I've aggregated over aren't necessarily the ones folks expect (e.g. they don't represent the "true" edges of the county boundary).

How can I overcome this disparity between the 3D and the 2D projections, specifically with respect to aggregating data?

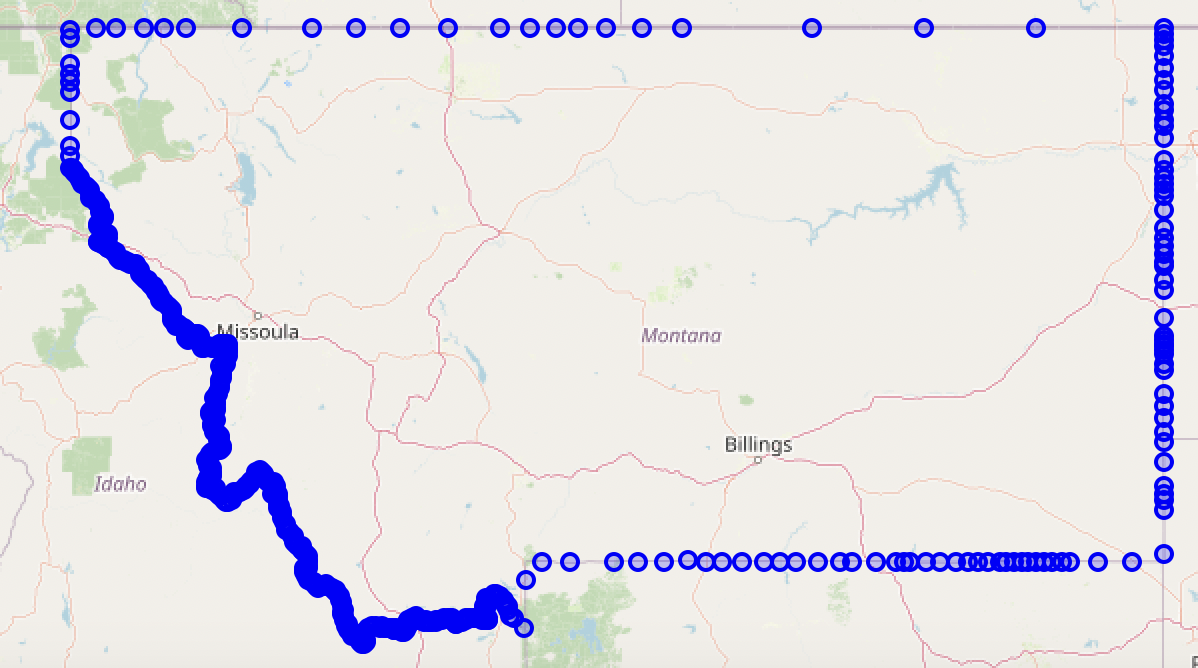
To illustrate, here is a map showing every 50th point in the Montana TIGER polygon:

enter image description here

Now, suppose that I have some arbitrary lat longs distributed around this map. I want to aggregate these points (say, just to COUNT them) to see how many of them are within the boundaries of Montana. If I were to perform my aggregation in ESPG:4326, I would actually end up counting some quantity of points that are in Canada, because the northern boundary of Montana (e.g. the implied line between the boundary points) is a straight line in ESPG:3857, but is not a straight line in ESPG:4326. So, at the very least, w.r.t. the northern boundary of Montana, I had probably ought to aggregate in ESPG:3857 rather than ESPG:4326. OTOH, the eastern boundary is a straight line in BOTH ESPG:3857 and ESPG:4326, so the aggregation will give the same results for points near the eastern boundary. I don't even know what to think about points along the crooked southwestern edge, but I suppose that they are dense enough that I wouldn't matter.

How can I overcome this issue between the edges of the 3D and the 2D projections, specifically with respect to aggregating data?

5
  • 1
    Hexagons won't look like hexagons in either 3857 or 4326. No distance analysis should ever be performed in Web Mercator (because distances in 3857 are useless). If you're working with CONUS counties use the USGS CONUS Albers. Alaska, Hawai'i, Puerto Rico, and Pacific territories require local projections.
    – Vince
    Commented Nov 28, 2023 at 14:11
  • I'm not quite sure I understood what exactly you have and what you want to achieve. To me, however, it sounds like the core of your problem is how to convert the edges of polygons from one to another CRS so that they follow the same path referring to Earth's surface. For this, first densify your initial polygons (add vertices), then reproject. See here how to do: gis.stackexchange.com/a/392248/88814
    – Babel
    Commented Nov 28, 2023 at 14:19
  • 1
    @Babel I think what you're saying is that at a certain point of densification of the polygons, then it won't matter which projection I aggregate in, because the great-circle line and the projected line pretty much coincide? This is a good point.
    – Him
    Commented Nov 28, 2023 at 14:22
  • @Vince "No distance analysis should ever be performed in Web Mercator" I'm not doing distance analysis, only a "contains" operation. If I'm displaying a polygon in Web Mercator, then it makes sense to perform my "contains" operation also in Web Mercator as well, yes? That way for users "what you see is what you get" so to speak?
    – Him
    Commented Nov 28, 2023 at 14:24
  • 2
    Yes, the shape is so to say "burnt" into to ground and you can strech the canvas as you want, the lines always follow the same features on the ground. Vector objects are most often modelled based on vertices and only vertices are transformed when you reproject, so the edges connecting vertices change, based on projection. the more vertices you have, the smaller this distorting effect is. You still have to think about the initial shape and projection and if this makes sense. For larger regions, always try to use geodesic lines.
    – Babel
    Commented Nov 28, 2023 at 14:56

0

Your Answer

By clicking “Post Your Answer”, you agree to our terms of service and acknowledge you have read our privacy policy.

Browse other questions tagged or ask your own question.