8

I am using QGIS 3.18.1.

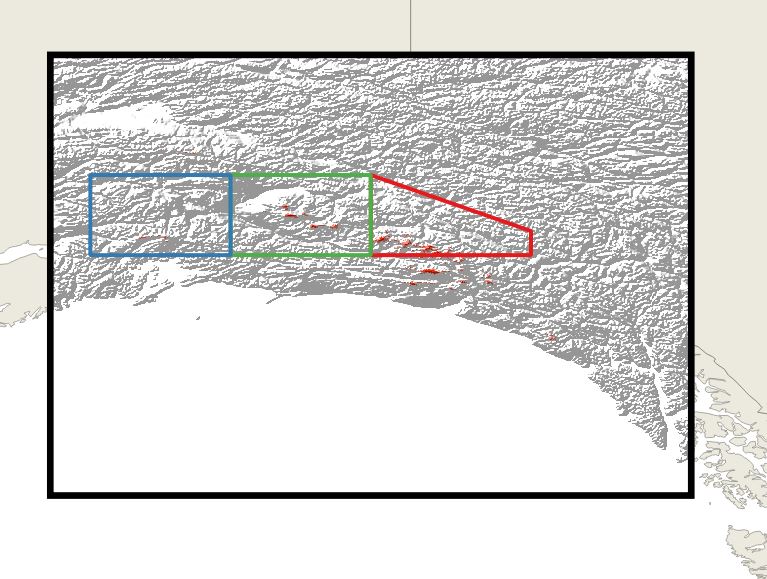
I am working on a map around Alaska. I added a world basemap, then added DEM and finally drew a few polygon shapefiles on top.

enter image description here

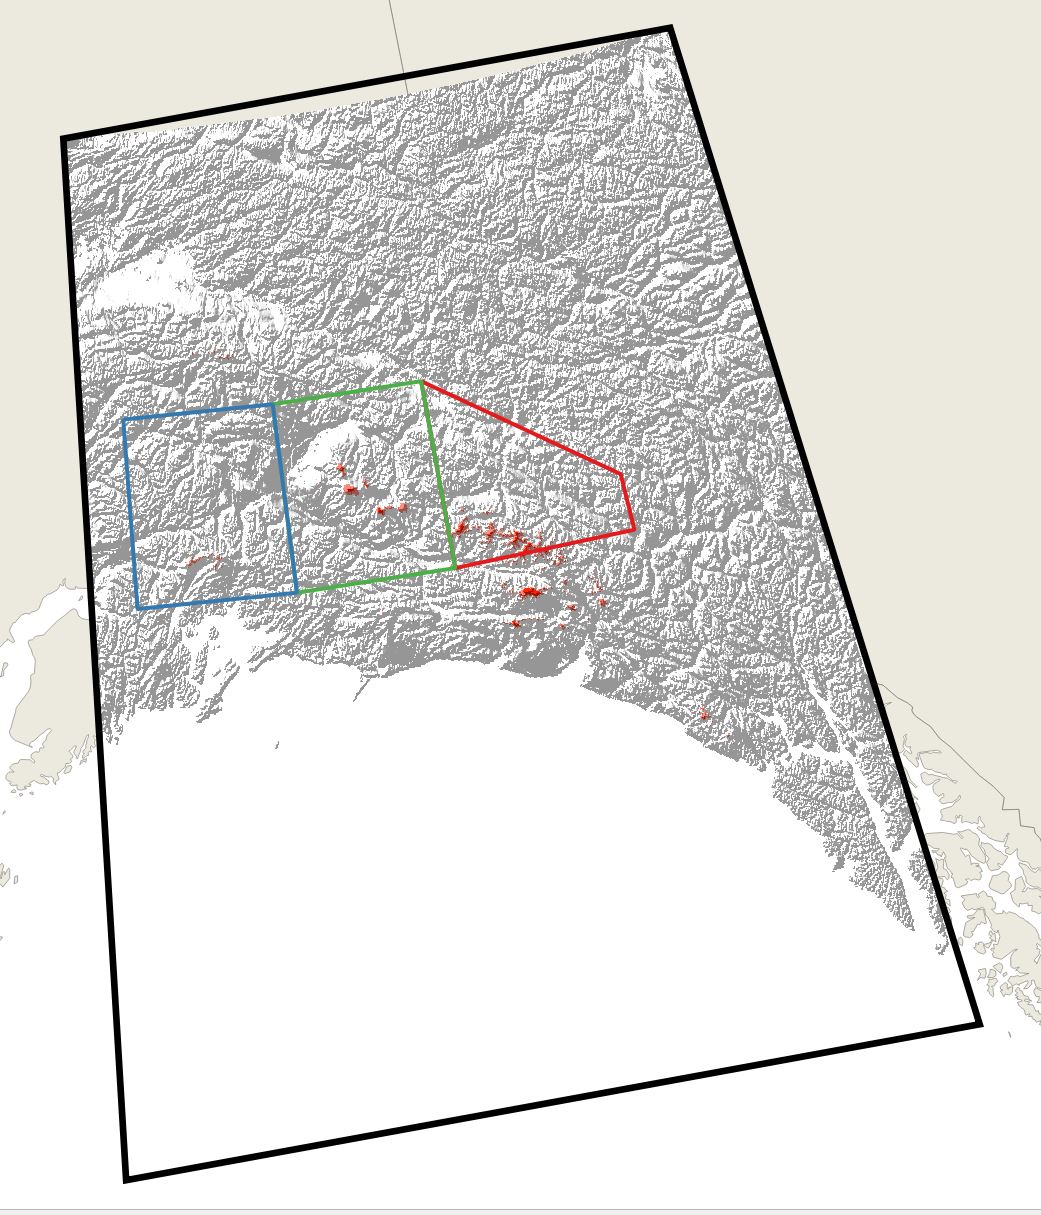
I then tried to find a projection more appropriate for that area and chose NAD83(2011) / Alaska Albers (EPSG:6393).

enter image description here

The world basemap and DEM for transformed nicely but I am not sure about the polygon shapefiles. Shouldn't the top and bottom lines be rounded off to follow the longitude? You can notice on the second image that the top of the DEM now curves while the shapefile remained straight.

I have tried exporting the layer as EPSG:6393 and adding it back. But still the same result. Any pointers?

1 Answer 1

15

What went wrong: If you transform, only the vertices are transformed, not the connecting line: this is always drawn as a straight line on the projected map canvas. So it's "path" will differ for each projection and always be a straight line.

What the solution should be like: What you want is in fact a geodesic line - a line that follows the same groundpoints on earth's surface, irrespective of which projection you use to show the map.

How to solve the problem: You should densify your polygon, i.e. adding vertices in regular intervals. Go to Menu Processing / Toolbox and enter densify. There are several options available: I would recomend Densify by interval. Set an interval of e.g. 1000 meters. You will get a new, identical (in the original CRS) polygon with a lot more vertices.

How the soulution looks like: I created a polygon in EPSG:3857 (Web Mercator), than set the project CRS to EPSG:6393. The red line is the outer boundary of the original polygon (=your case). The black line is the outer boundary of the polygon with densified line (interval=1000 m):
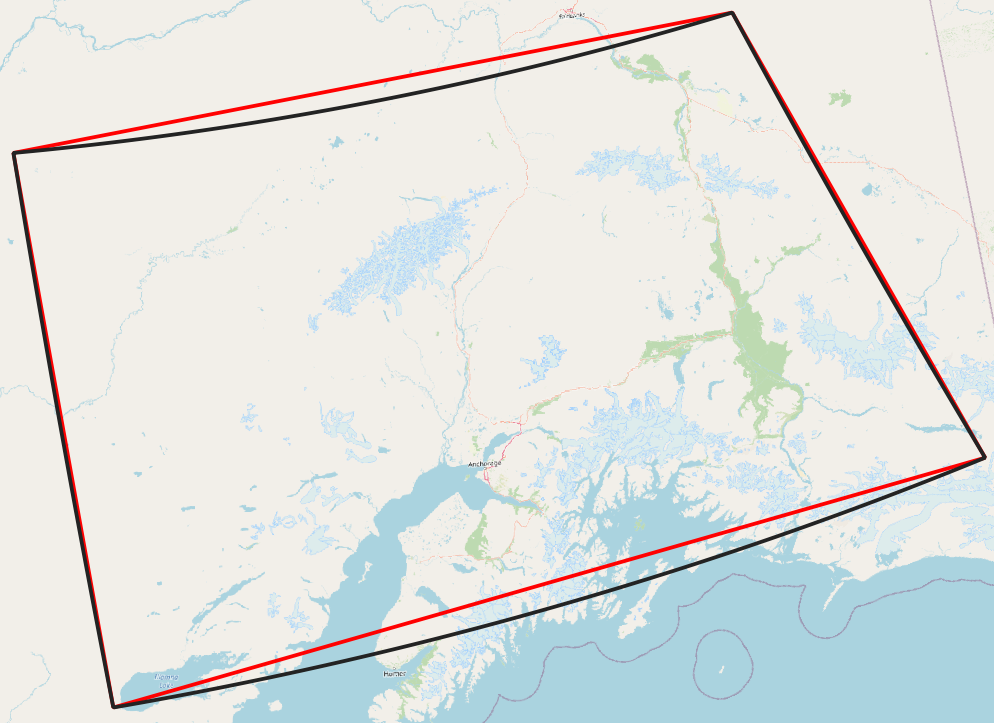
enter image description here

You can also create the effect with QGIS expressions and function densify_by_count(): see screenshot with layer in EPSG:4326 and project in EPSG:6393: black outline (initial polygon without any changes) and red outline (densified polygon):
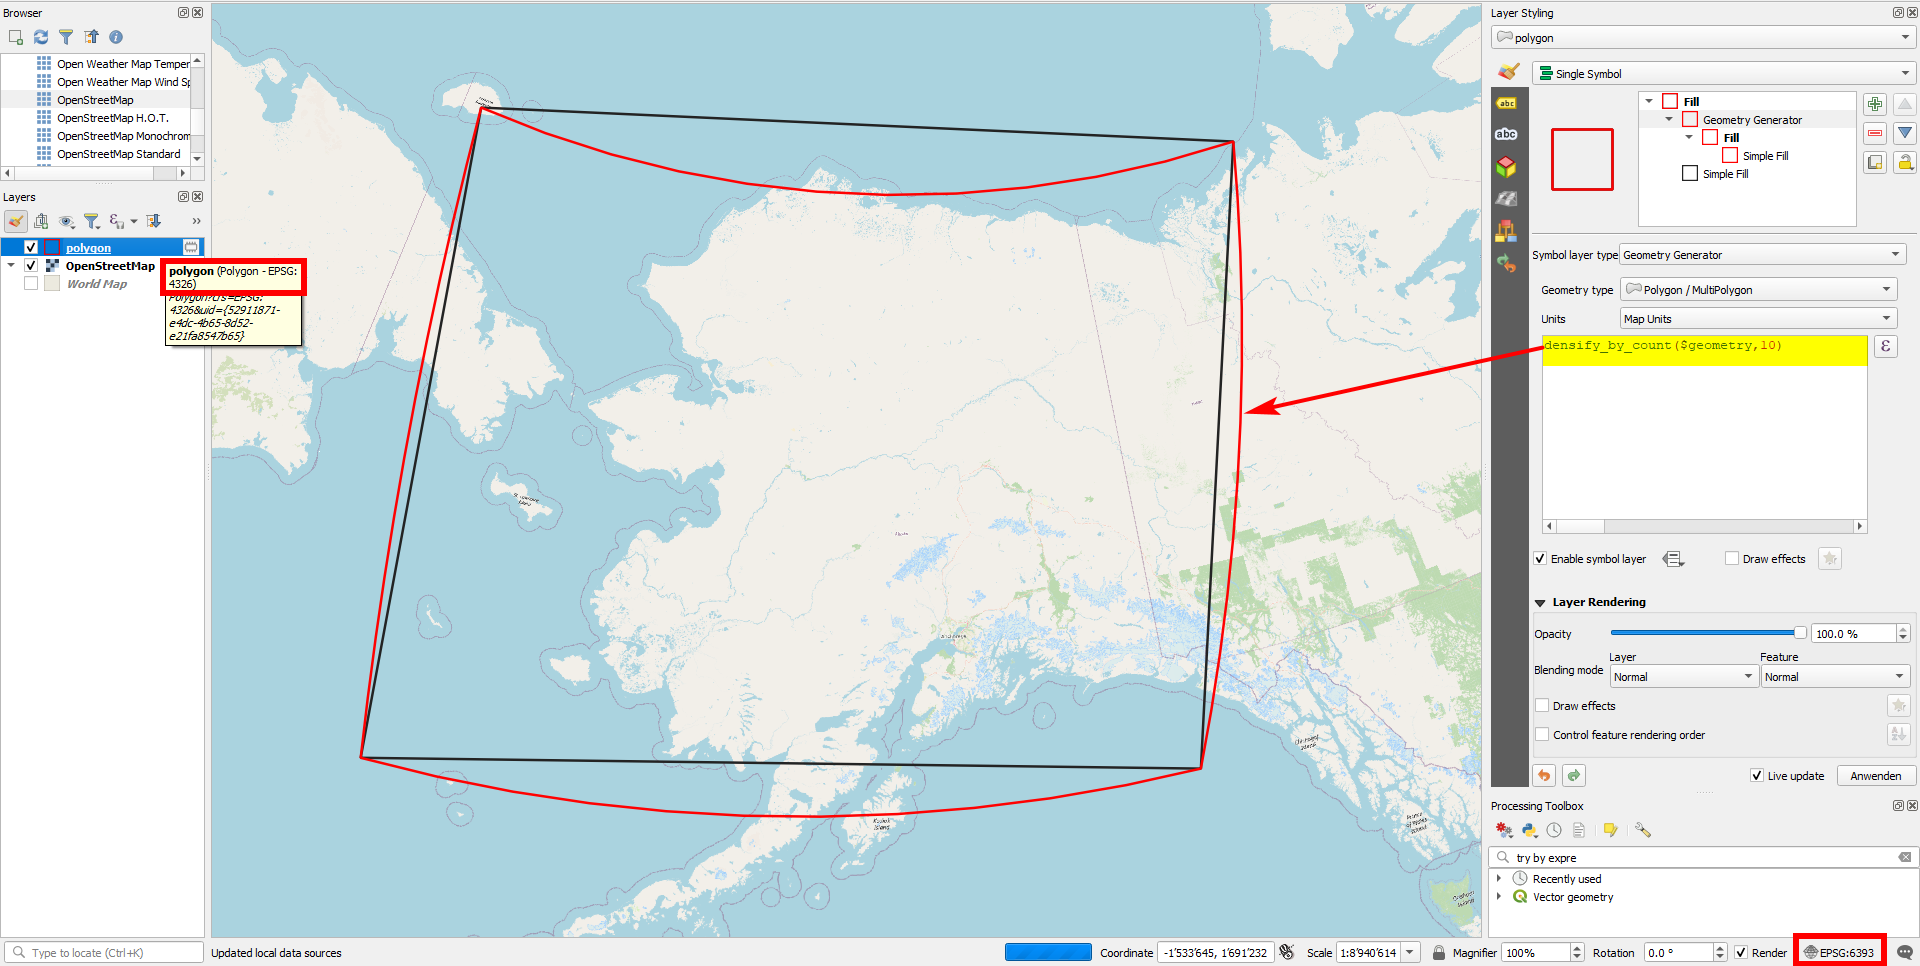
enter image description here

3
  • 1
    Thank you for your help it works very nice. Only doubt is how to set the interval to meters like you suggested. Seems the only option is by degrees? Commented Mar 27, 2021 at 12:50
  • 2
    So than you might use densify by count to set an absolute number of additional vertices. Otherwise you should first re-project the polygons, but than you loose exactly this geodesic shape. You could also set a distance of like 0.01 degrees.
    – Babel
    Commented Mar 27, 2021 at 12:56
  • 1
    Thanks again for your time, worked like a charm! Commented Mar 27, 2021 at 13:00

Your Answer

By clicking “Post Your Answer”, you agree to our terms of service and acknowledge you have read our privacy policy.

Not the answer you're looking for? Browse other questions tagged or ask your own question.