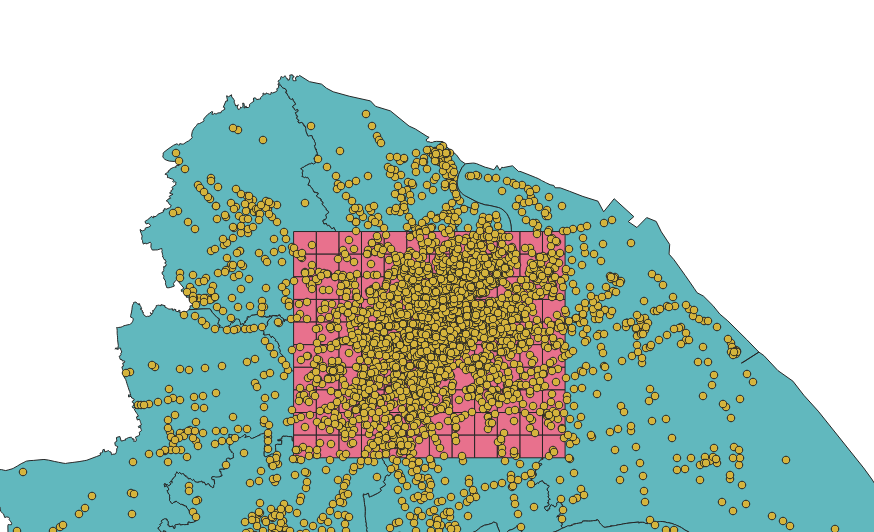
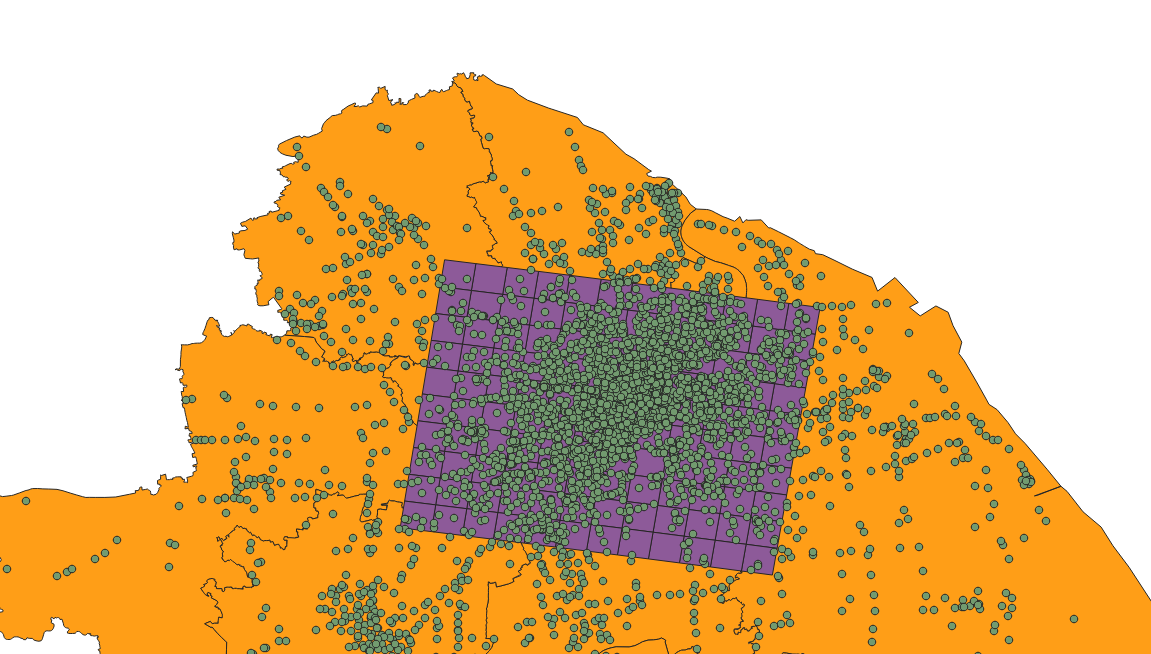
How do I draw a grid of n by n on the shapefile of a city with a CRS of EPSG:4326?
I have tried creating gird in ESPG:32735
I have created a grid using this.
Vector -> Research Tools -> Vector Grid
But when I try to export it as EPSG:4326, this grid gets stretched, and I can't use it in python.
Multiple tries that I did
SAGA -> Vector general -> Create polygons graticule
MMQGIS -> Create -> Create Grid Layer
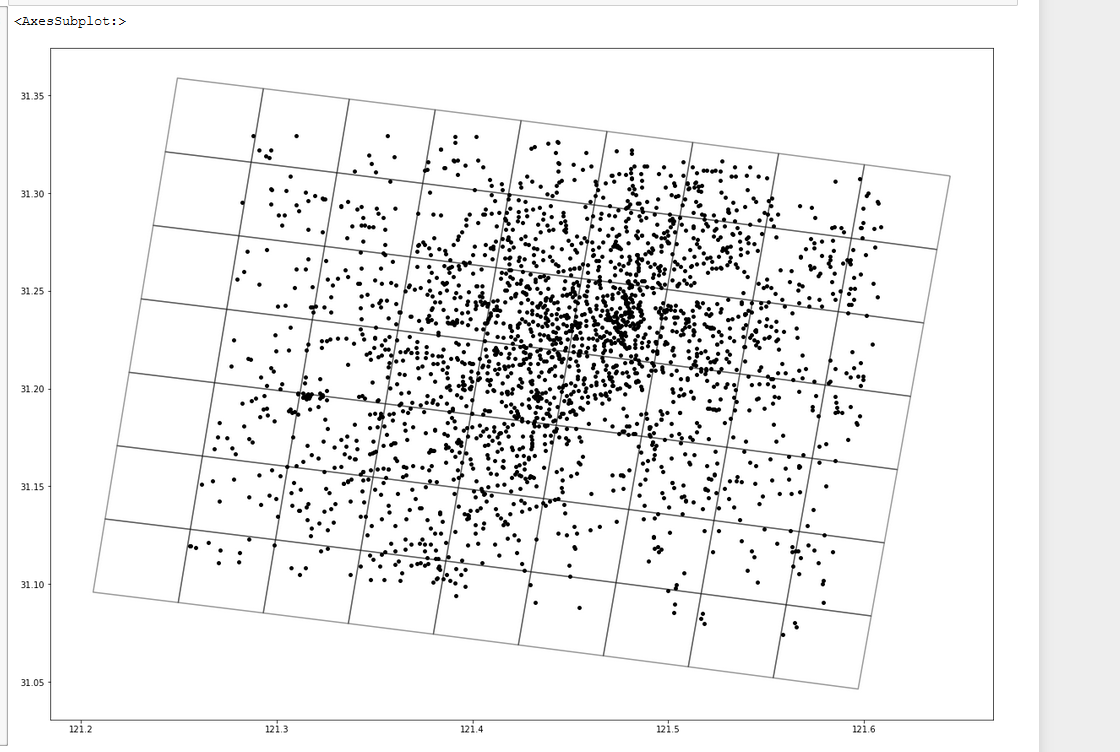
Python result
temp_shapefile = gpd.read_file('../temp/tempgrid.shp') <br>
fig,ax = plt.subplots(figsize = (15,15)) <br>
temp_shapefile.boundary.plot(ax=ax, alpha = 0.4, color="black") <br>
df_Selected.plot(ax=ax, markersize = 15,color = "black", legend=True)


