1

Statistics for an asymmetric raster-cell neighborhood are required.

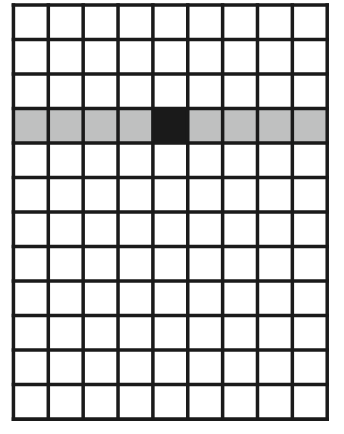
The application is modelling direct solar insolation over year-long time steps while accounting for local shading effects of vegetation for an ecosystem energy balance. Consider for instance that at certain times of year, the sun will be directly overhead. In this case, direct rays from the sun will trace a right-to-left (east-to-west) path. In the image below, the black box is the target cell and the grey boxes are the daily path of the sun.

enter image description here

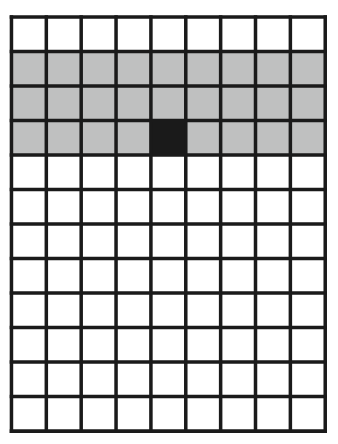
However, during other times of the year, the Earth tilts. When this happens, the direct rays entering the black square will be filtered through vegetation in a direction that is dependent on the season and this will have an important shading effect that must be considered. In the grid below, this shading effect induced by Earth's tilt is represented as grey squares with the black square again the target cell.

enter image description here

The focal() function from terra can be used to calculate statistics for matrices, and according to the documentation, rows and/or columns of 'NA' can be added to modulate what window is used to generate statistics from. I am not certain how to create such a window.

In addition, focal() results in a statistic for a center cell. What this means is that, in the second image above where seasonal shading effect occur, the black cell would (by focal) be shifted up one. This needs to be adjusted or accounted for.

1 Answer 1

1

Create a 9x9 matrix, 2 row of 0s, 3 rows of 1, 4 rows of 0...

M = matrix(0, 9, 9)
M[3,]=1
M[4,]=1
M[5,]=1

Giving:

> M
      [,1] [,2] [,3] [,4] [,5] [,6] [,7] [,8] [,9]
 [1,]    0    0    0    0    0    0    0    0    0
 [2,]    0    0    0    0    0    0    0    0    0
 [3,]    1    1    1    1    1    1    1    1    1
 [4,]    1    1    1    1    1    1    1    1    1
 [5,]    1    1    1    1    1    1    1    1    1
 [6,]    0    0    0    0    0    0    0    0    0
 [7,]    0    0    0    0    0    0    0    0    0
 [8,]    0    0    0    0    0    0    0    0    0
 [9,]    0    0    0    0    0    0    0    0    0

and pass that as the window parameter of focal.

3
  • This answers the bulk of the question - thanks for your time!... The focal() function would return a statistic for the cell at [4,5] in your solution and not [5,5] which is what I'm after. There may be a more suitable function? Commented Jun 16 at 14:59
  • No, focal would return, for all cells (i,j), the result of evaluating the function considering the values at all cells set to 1 when the matrix is centred at (i,j). It returns a grid the same size as the input, except for possible edge effects. I think maybe what you really want isn't clear, for example I don't understand why your grids are the shape they are...
    – Spacedman
    Commented Jun 16 at 16:11
  • You are mostly correct but what is maybe not clear is that referencing is important... For instance, consider in the second image of my question that the black square is at [4,5]. Using M from you solution as the window, if we call focal for [4,5], then we get a rectangle where [4,5] is the center tile. However, we want to call [4,5] from my question but have the center tile be [3,5]... Also, I've added context to the question and am hopeful it is helpful... thanks again for your time! Commented Jun 16 at 23:07

Your Answer

By clicking “Post Your Answer”, you agree to our terms of service and acknowledge you have read our privacy policy.

Not the answer you're looking for? Browse other questions tagged or ask your own question.