6

I want to map out moisture availability using satellite image but I do not know how to convert the raster image to a thematic map with limiting boundaries like state boundaries.

I am using ArcGIS 9.3 and ENVI 4.3.

An example of expected result is shown in a link provided below. I have satellite image who follows the same color gradient and I want the image to be displayed in shapefiles according to certain boundary shapefile.

http://www.drought.unl.edu/dm/monitor.html

EDIT

I have posted a sample MODIS image here and a sample expected result of a drought map accessed from UNL.edu.
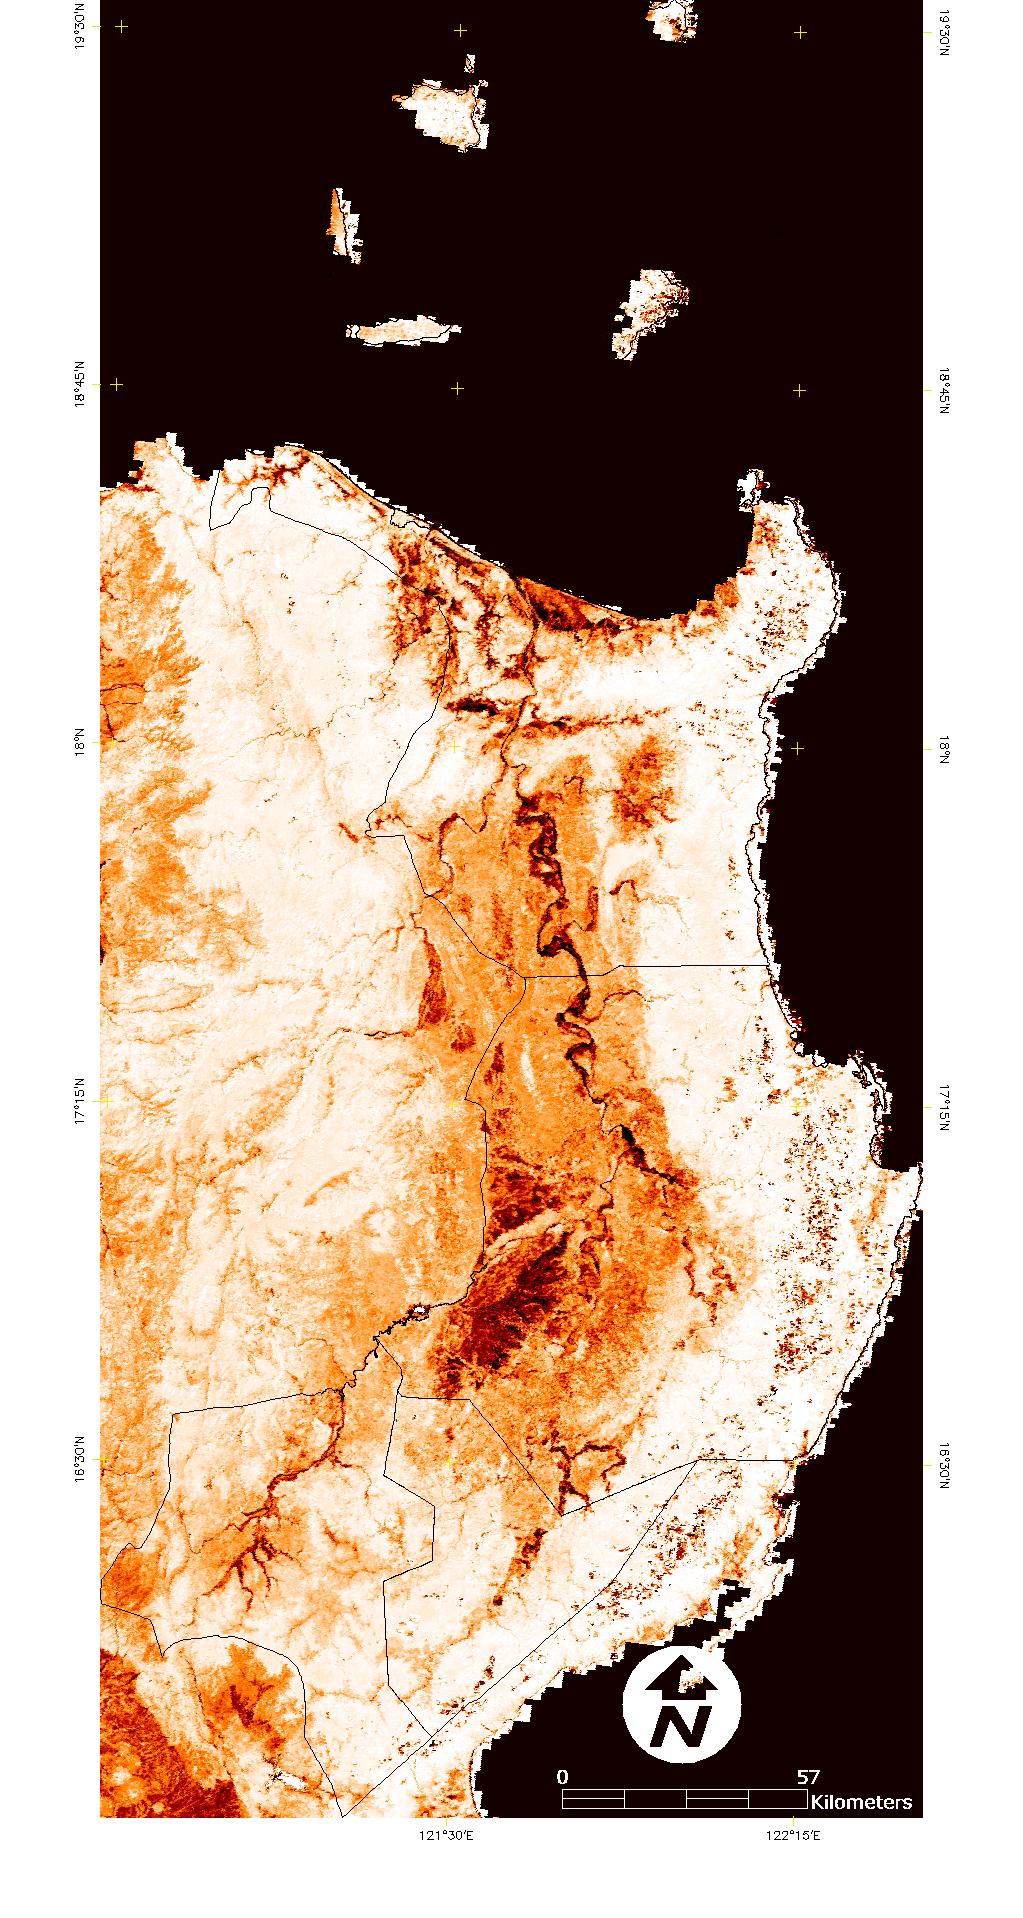
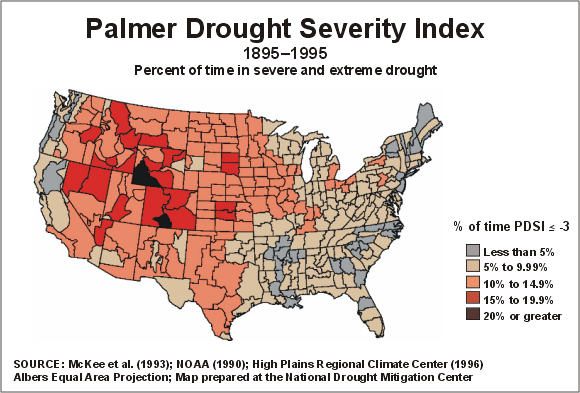
So, I am not sure about the classification. Please do enlighten me on this matter.

1
  • 1
    In light of the edit, it is unclear what the question is or even if there is one question here. It seems you want to mask a grid to a polygonal region. But what is your question about "the classification"?
    – whuber
    Commented Apr 2, 2011 at 16:09

2 Answers 2

6

I don't use ArcGIS or Envi but a general approach would be to aggregate the raster values (either by mean, min, max, stddev, variance, etc.) within the polygon and add these data into the attribute table.

Grass GIS has the v.rast.stats module

1
  • 2
    (+1) I see what you're getting at: you view the problem as (1) converting the image to a "moisture availability" index for each polygon and (2) creating a choropleth map of this index. The first step is a zonal operation, which is performed by v.rast.stats in GRASS (and ZonalStats in ArcGIS/Spatial Analyst). This sounds right (in light of the edit), but there's a complication: the "moisture availability" (whatever it is) is probably not a simple statistical summary of the image values.
    – whuber
    Commented Apr 2, 2011 at 17:39
2

Quick and dirty way: create a polygon for the complement of the region to be shown (by subtracting the region from a large rectangle, for instance). Draw this polygon over the raster.

Better: the states should be polygons. Convert the state layer to a raster. Use that as a mask to clip the image. For a tutorial, see Better Raster Clipping Options in ArcGIS.

BTW, the image cannot be "displayed in shapefiles" because shapefiles (a) do not store images and (b) do not store graphical information. They store only the coordinates for representing vector features (along with the attributes, of course).

Your Answer

By clicking “Post Your Answer”, you agree to our terms of service and acknowledge you have read our privacy policy.

Not the answer you're looking for? Browse other questions tagged or ask your own question.