Embedded cursors are the worst way to program anything. Don't do it. Your code fails because cursors only read one way once. So the interior cursor has to be completely rebuilt from scratch and started over for every record in the outer cursor. For every additional record you have to compare in each table the time it takes to compare the two tables grows on basically an exponential growth curve, which should be avoided at all costs if you have anything more than 50 records in each table.
Your cursors also are not da cursors, so they are 10 time slower out of the gate. Use two completely separate cursor loops. One to read the data from the sources to two dictionaries and the other to update the features based on matches made to the dictionaries. Dictionaries are random access structures, cursors are not, and dictionaries are in memory while cursors are not. So you get about 20 to 100 time better performance with the approach I am recommending. See my blog on Turbo Charging Data Manipulation with Python Cursors and Dictionaries.
You are using UpdateCursors but not writing anything to the table. Why? You need an X and Y field to write to. You only need one UpdateCursor on one source ever, never two on the same data source. Define those fields and their names and which table they will reside in.
So study my blog and start over. You will be glad you did.
Thanks for editing your post with a graphic that explains the source of the tables and the objective of the analysis as well as better tables to work with. The first step is to add 4 Double fields to the table with the two src_RefName and nbr_RefName fields to hold the XYs of the two centroids from the other table so there is a place to store the results of the updatecursor. I will call them X_Start, Y_Start, X_End, and Y_End. Also add another double field for Bearing. The Bearing calculated below is the trigonometric bearing that begins at due east and goes counter-clockwise, not the navigational bearing that begins at due north and goes clockwise. If you want the navigational bearing then change the line that reads: updateRow6 = (angle + 360) % 360 to updateRow6 = (90 - angle) % 360. The bearings association to the compass points are [45-135] = North, [135-225] = West, [225-315] = South, [315-359.9..., 0-45] = East.
Now load the table with the centroid XY into a dictionary. Then get the two RefName values of each row and fill in the 2 XY coordinates and the bearing double fields. The third example in my blog can be adapted to do the process.
from time import strftime

print "Start script: " + strftime("%Y-%m-%d %H:%M:%S")

import arcpy
from math import degrees, atan2

sourceFC = r"C:\Path\SourceFeatureClass"

sourceFieldsList = ["RefName", "POINT_X", "POINT_Y"]

# Use list comprehension to build a dictionary from a da SearchCursor
valueDict = {r[0]:(r[1:]) for r in arcpy.da.SearchCursor(sourceFC, sourceFieldsList)}

updateFC = r"C:\Path\UpdateFeatureClass"

updateFieldsList = ["src_RefName", "nbr_RefName", "X_Start", "Y_Start", "X_End", "Y_End", "Bearing"]

with arcpy.da.UpdateCursor(updateFC, updateFieldsList) as updateRows:
    for updateRow in updateRows:
        # store the src_RefName and nbr_RefName value of the row in a pair of keyValue variables
        keyValue1 = updateRow[0]
        keyValue2 = updateRow[1]
         # verify that the keyValues are in the Dictionary
        if keyValue1 in valueDict and keyValue2 in valueDict:
            # transfer the value stored under the keyValues from the dictionary to the updated field.
            updateRow[2] = valueDict[keyValue1][0]
            updateRow[3] = valueDict[keyValue1][2]
            updateRow[4] = valueDict[keyValue2][0]
            updateRow[5] = valueDict[keyValue2][3]
            angle = degrees(atan2(valueDict[keyValue1][4] - valueDict[keyValue2][5], valueDict[keyValue1][0] - valueDict[keyValue2][0]))
            updateRow[6] = (angle + 360) % 360
            updateRows.updateRow(updateRow)

del valueDict

print "Finished script: " + strftime("%Y-%m-%d %H:%M:%S")
Edit:
You have extended your question to a different problem about trying to accurately describe the picture using a table of compass directions. In doing this you are raising a much bigger problem. Writing a program to evaluate your picture correctly into this table is like trying to get a group of blind men to agree what an elephant is like when they only experience a small part of it. That is what you are attempting when you program complex realities into simplified generalizations and break it up into separate examinations of small parts. It is nearly impossible to have blind men operating this way come up with the same description of reality that a sighted person will explain.
Our eyes and brain are amazing at nearly instantly determining what to take in and what to throw out when trying to evaluate the picture you gave, and no program you or I can write can equal it. However, even for sighted people the complexity of your shapes means that there is no perfect table, since even sighted people can approach your problem from several points of view and come up with different compass direction description tables (I can see several correct answers myself, depending on the methods I adopt). So at some point you have to be satisfied with the imperfections generalizations always create and the limitations of a chosen methodology. But that does not mean you are limited to a program that only considers just one methodology. However, the methodologies should to be applied in a progressively more complex way after less complex approaches prove inadequate.
For example, you have not really evaluated the bearings of your polygons where they touch, you have only evaluated the bearings of your polygon centroids. This is the part of the elephant your blind men have experienced and currently told you about this elephant.
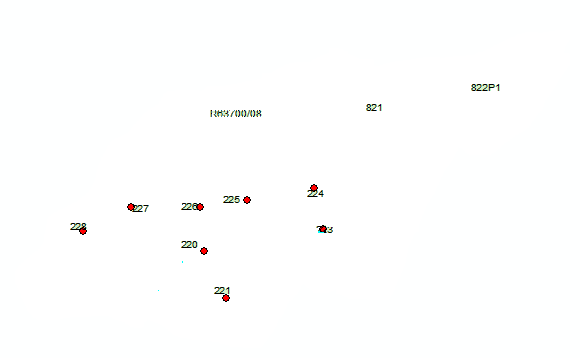
Those centroids may have a poor relationship to the shared edge of your polygons. A potentially better analysis is to examine the two bearings of the polygon centroids to the centroid that falls on the shared edge of your polygons. As part of that analysis you probably also must determine which polygon is along the right side of the shared edge and which is along the left side of the shared edge to get the normal angle to the line at the line centroid for each polygon. This will form another set of angles that could reveal the sufficiency or insufficiency of the centroid bearing you have already examined for describing the relative compass orientations of the two polygons. Obviously translating this set of angles to equate to what your eyes and mind consider is more challenging, but probably more like what your brain is actually doing. You could also look at the ends of the shared edge and their normal angles as yet a further way to evaluate the adequacy of the centroid of the shared edge for giving a picture of reality. Here is a picture of the part of the elephant that this shared edge centroid analysis could paint:
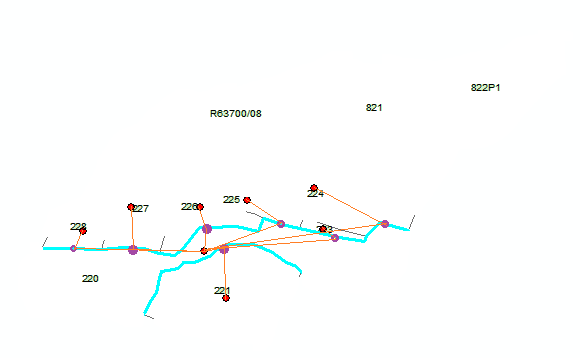
If you look at the bearing of the centroid of polygon 224 to the centroid of polygon 220 in the first picture it appears that the bearing relationship should be described as southwesterly. However, when you look at the picture of the bearings of the centroid of polygon 224 to the centroid of its shared edge with polygon 220, it is clear that the bearing relationship between 224 to 220 from that point of view is more accurately described as a southeasterly bearing relationship. From different points of view, both are true of this elephant. The question is, do you only accept one of these answers as true or do you accept both as true?
But what if the two polygons touch in multiple places and share more than one continuous edge? What do you do then? The answer is always solve the simplest problems first and then find a way to isolate the set of objects that defy that solution and retest only that set. That is what makes a good program process efficiently without wasting precious time doing a lot of unnecessary evaluations.
As you can see this problem can go way beyond what a simple post can answer and depending on the importance of this table to your analysis needs, only you can determine how much time you are willing to spend getting the programmatic blind men closer to the reality of the elephant that you, the sighted man, see. Nonetheless, now you can see that the technique of converting non-random access cursors to random access dictionaries (and now lists inside dictionaries) is essential to make it even possible to evaluate the problem efficiently.
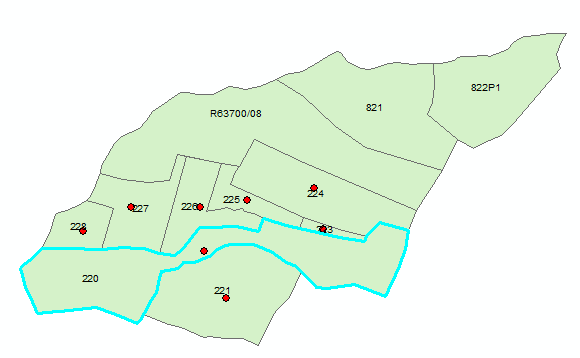
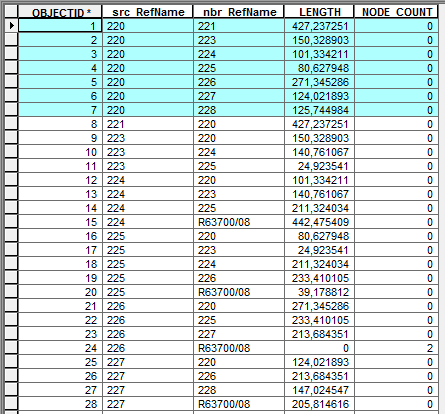
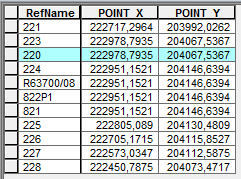 For doing this I used three loop for, and I think it's turning right, but it does it just for the first row, and doesn't move to the newt row!
 The result i get was good! But it doesn't respond at 100% to my need, to be more clear let's see the example of parcel 221, it has parcel neighbor 220 at North and also West, but at the table we can see just North, for that i want to canncatenate this result to the result of the function
  Let's take the exmaple P220, we can see that it sets just 224, 226 on North, even if there is More !
So the idea is to concatenade the two results to get at last one more complete and reliable result !
But how to do it ? i can't find one logic to combinate them !!
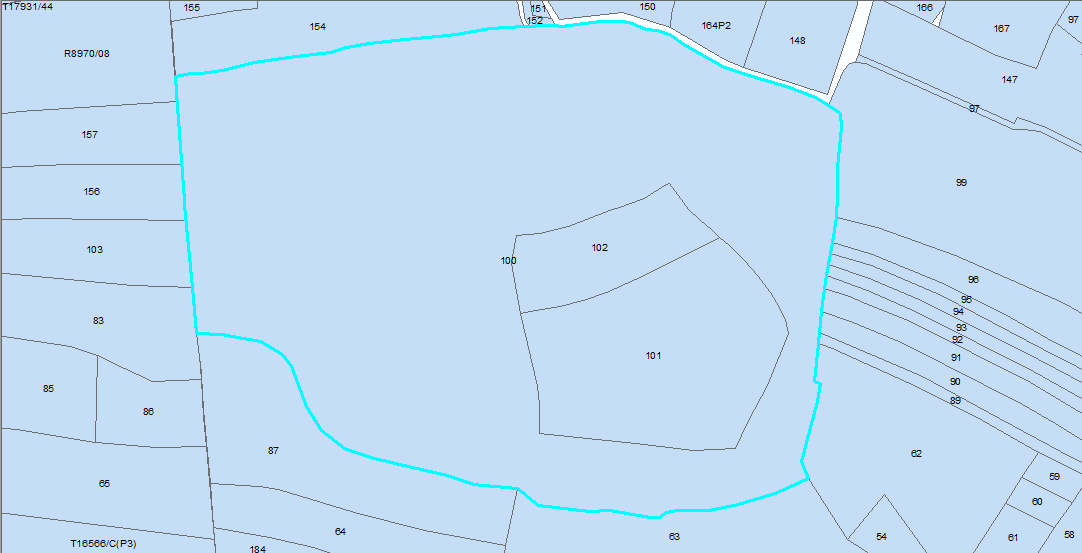 the lin in color, presents Neighbors picked up by the program, and when i looked what a kind of parcels mess, i found is just who is not in touch with the taget parcel (as 164 P2 and 150 in North..)!!


