0

I have a DSM of a small city center, and for planning purposes I wish to assess the impact of a very high building on the urban skyline. By impact I mean: given a tall building, what part of the urban landscape would not be visible from given viewpoints? While I have experience with viewshed analysis in ArcGIS (10.1), I do not manage to wrap my head around how to proceed on that specific issue. What I believe could be done is to select a number of (random) points within the urban area of interest, and calculate related viewsheds, in order to assess what part of the urban 'landscape' is actually blocked by the (future) high building. BUT, my issue is:

how can I simulate the presence of a high building (or, for instance, of added third or fourth floors on an existing building)?

Is it something that I can add to the DSM (how?)?

Can I use a shapefile, and, if I can, how the procedure should be set up?

4
  • Just raise your DEM where the building are, and repeat viewshed analysis on the same set of points
    – FelixIP
    Commented Jun 24, 2015 at 19:12
  • Thank you @FelixIP. What do you mean by 'raise your Dem'? Plus, just to add some info, I have a lidar-derived DSM which comprises buildings. But, as I said in my earlier post, I want to 'simulate' the effect of adding some floors to existing buildings to assess how the visibility would change.
    – NewAtGis
    Commented Jun 24, 2015 at 19:53
  • If you have an outline of this building, convert it to raster, using field with value equal existing height+2 levels*3 m. Mosaic it with original elevation model. Don't use tool, use raster calculator Con(IsNull('small'),'big','small'). Make sure both rasters have the same extent and cell size (use environment settings for this prior to polygon to raster conversion)
    – FelixIP
    Commented Jun 24, 2015 at 20:33
  • @FelixIP: Sorry for the new question, and by the way thanks for the earlier one. So, I have created a polygon representing the extent (in planar view) of the existing top floor of a given building. By 'add surface information' tool, I added the elevation of that top floor to the polygon's attribute table. By means of 'polygon to raster' I created a raster of that polygon, which has a value corresponding to the current elevation PLUS 6 meters (2 floors). Now, could you explain with some more detail what is Con(IsNull('small'),'big','small'), and what those 'labels' stand for. Thank you
    – NewAtGis
    Commented Jun 25, 2015 at 10:18

1 Answer 1

1

In short you have to modify DSM inside building outline.

  1. Use Geoprocessing - Environment _ Spatial Extent to set it to DSM.
  2. Use Geoprocessing - Environment _ Raster Analysis - Cell Size to set it same as DSM.
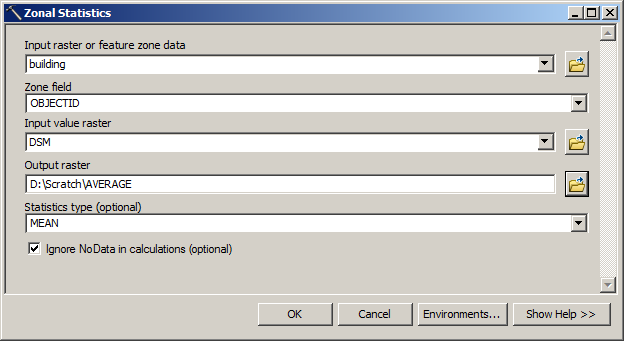
  3. Calculate average elevation for building, using it's outline enter image description here
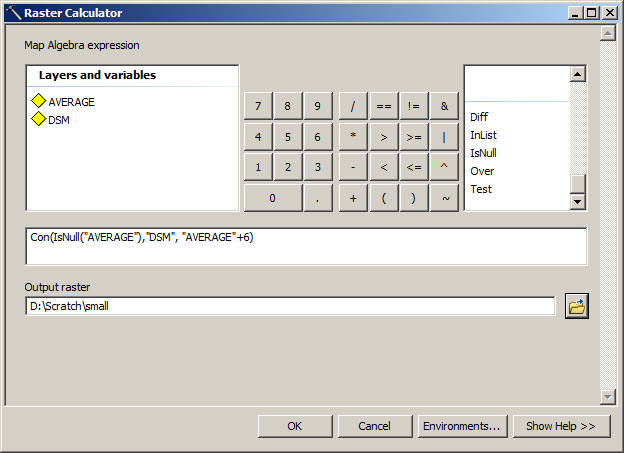
  4. Use Raster Calculator to raise a part of your elevation: enter image description here

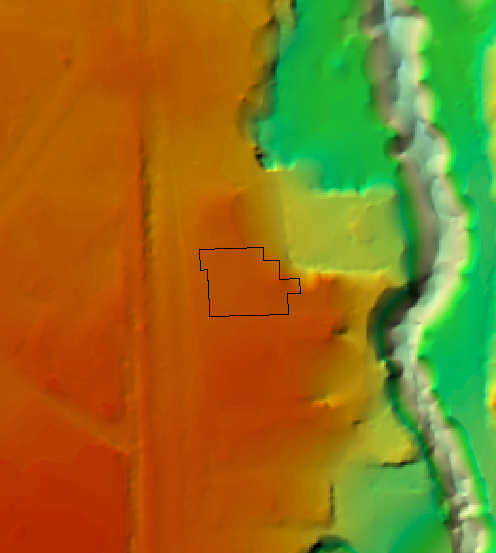
This will result in changing your of elevation from:

enter image description here

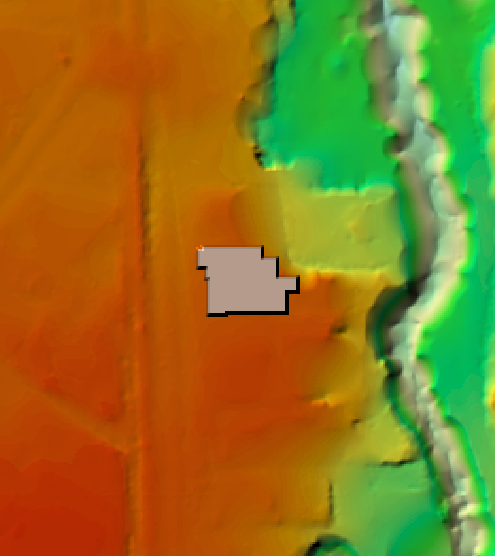
to

enter image description here

Repeat your viewshed analysis using what I call 'small' in above example.

When placing observers, I'd suggest to put them on concentric circles around the building. Expect to see bigger 'skyline pollution' for points closer to building in low places. Also avoid placing observers inside other buildings, because you'll have to deal with the issue of 'where the window are'. (I'd even erase buildings outlines from viewsheds).

On the other hand if this research is about animal welfare, e.g. 'California's Association of Stargazing Persians' you might very well place them on the roofs. Don't forget to place a couple on building of interest. These two will benefit from building upgrade and might request name changes later to Hillary & Tenzing. https://en.wikipedia.org/wiki/1953_British_Mount_Everest_expedition

1
  • Thank you. Now I got it. I took the longest way using the procedure I described (for the first part of the problem). 'Zona statistics' saved a lot of time. And, finally, I understood (unless I am mistaken) the the syntax in the Raster Calculator is aimed at substituting the raster produced by Zonal Statistics into the corresponding sector of the original DSM. Thanks.
    – NewAtGis
    Commented Jun 26, 2015 at 6:44

Not the answer you're looking for? Browse other questions tagged or ask your own question.