8

We have raster data which is generated from (vertical) walls. We would like to keep this data in a postgis database and have the spatial reference encoded "the most accurate way".

Currently, they are saved by abusing a metric CRS and encode the z coordinate of the wall as y, and the offset from the left side of the wall as x. This gives a local reference system which works for its purpose but loses the global context.

For vector data it is straightforward to give every vertex a 3D coordinate to locate it in (global) space. This is what should be created based on the raster data (use a GIS User Interface to digitize areas of interest on top of these walls).

Furthermore, multiple walls can be situated next to each other and it should be possible to visualize these in this context (it's enough if it only works if they have the same azimuth).

There are some approaches available how this could be tackled:

Use a custom CRS in vertical space, which has its origin based on a real-world coordinate. However where exactly this "origin reference" would be stored is still unclear.

  • Save the information in the CRS (is that possible?) - Would require several different CRS'es for each reference plane.
  • Use a foreign key to a line (see red lines in sample) - Current situation, redundant information (what if the length of the line does not correspond to the width of the raster?)
  • Create a 3D polygon as reference plane - Redundant information, see above
  • Create an origin point on the line, which in combination with the azimuth of the line can be the reference plane - Would different walls share the same reference plane?

All of the approaches seem to be somehow "workarounds" and have their caveats.

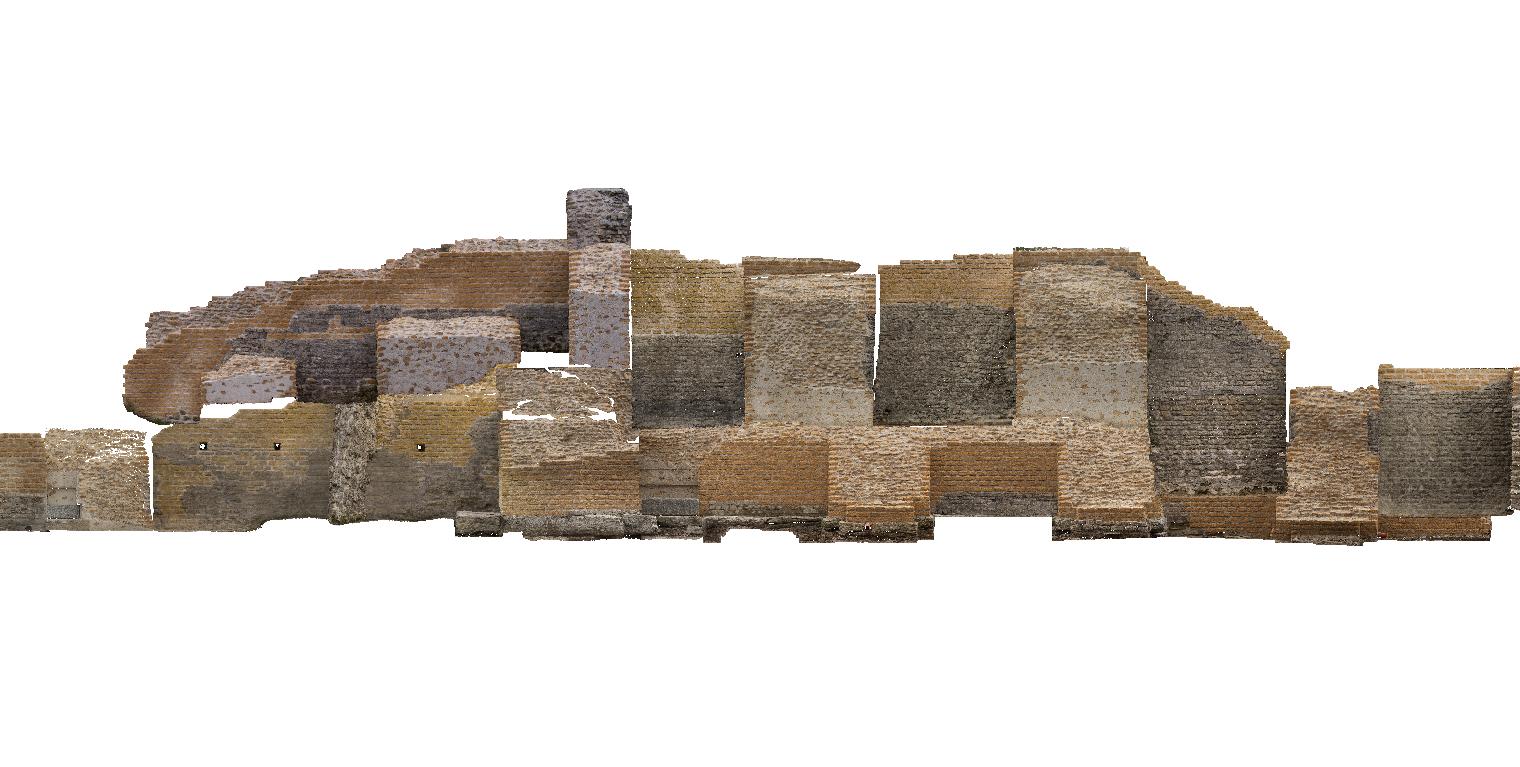
The two images below show a topview of the situation and a composition of several frontal raster images. (It's ok if they are mapped to a single reference plane)

What is the most appropriate way to store the vertical raster images in the database while not losing its geographic context in horizontal space and with elevation information?

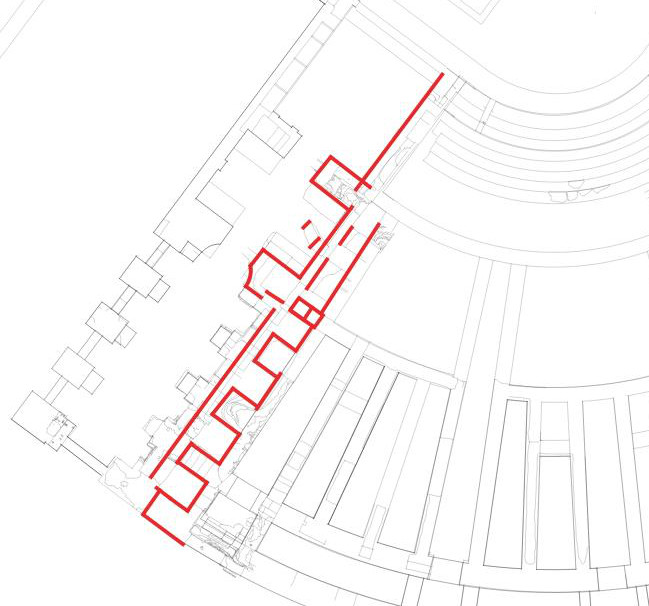
Topview plan of the situation, red lines correspond to real world location of the rasters.

A set of orthorectified raster images, corresponding to red lines with the same azimuth.

3
  • 3
    whats the question again?
    – nickves
    Commented Dec 18, 2015 at 17:47
  • Have you thought storing your data in a NetCDF format? I haven't done much in this area, but it is a possible pathway, you can store your vertical data as an additional dimension.
    – yanes
    Commented Dec 18, 2015 at 19:22
  • 1
    Right, we are at a Q&A site :) Question formulated. While we still have all the possibilities open in this project (i.e. NetCDF would be a possibility) I would not want to loose all the advantages introduced by a database. Commented Dec 19, 2015 at 8:18

1 Answer 1

1
+200

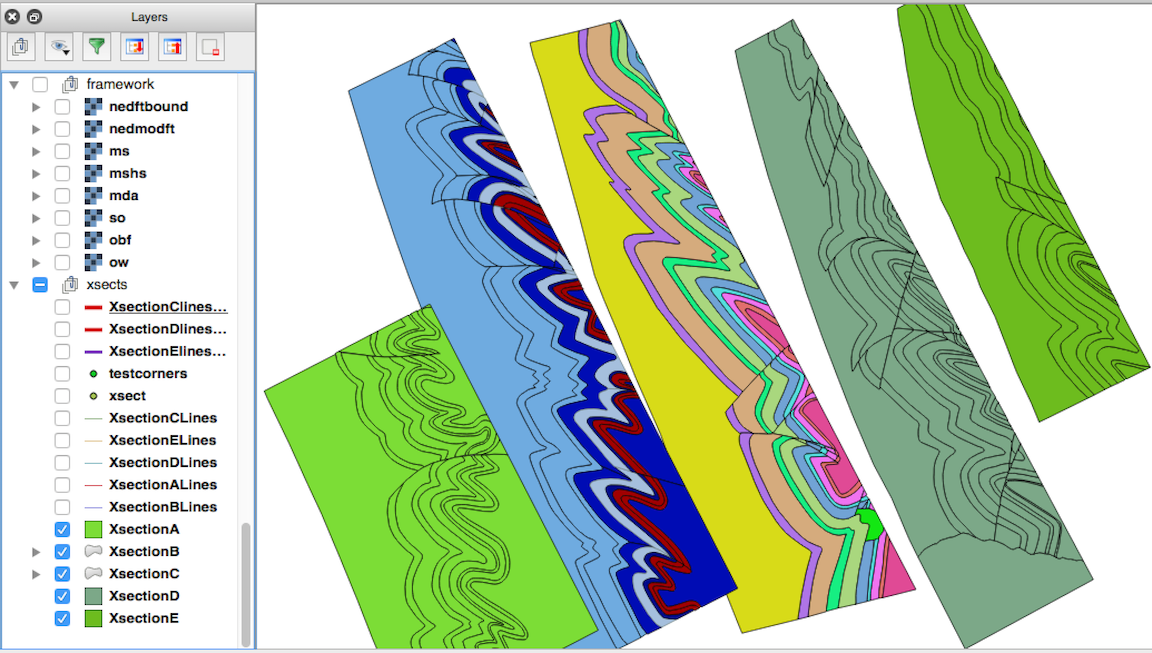
doubtful it's the elegant answer, but it sounds similar to something we did - where we started with scanned cross sections (vertical rasters, like your walls). We georeferenced the images where the offset from the left side was the x coordinate, and the height of the x-section was y. these coordinates were in the same CRS as all our other map data for the area.

digitized polygons

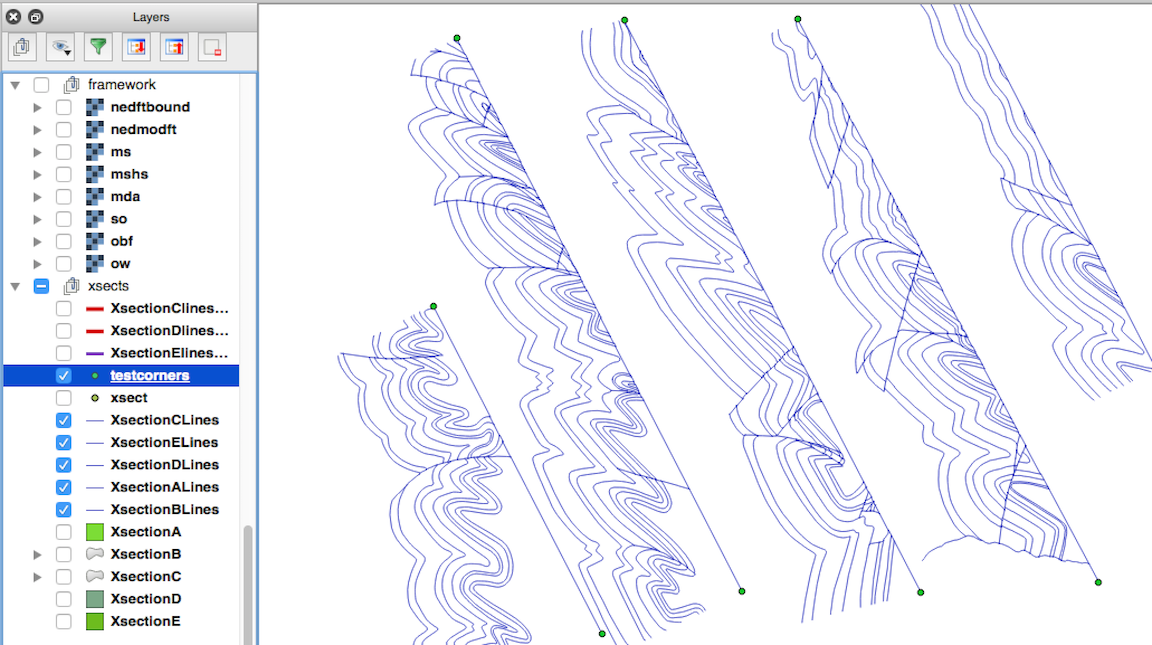
We then simply digitized the rasters, and included a separate point dataset to indicate the true start/stop corners of the cross-sections

digitized lines

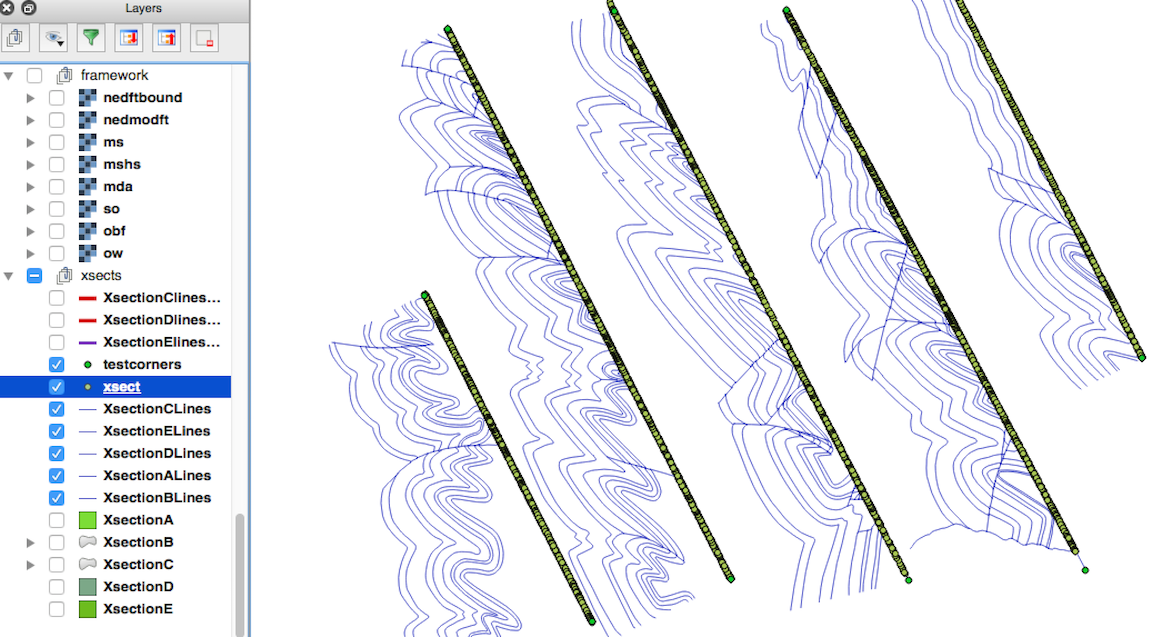
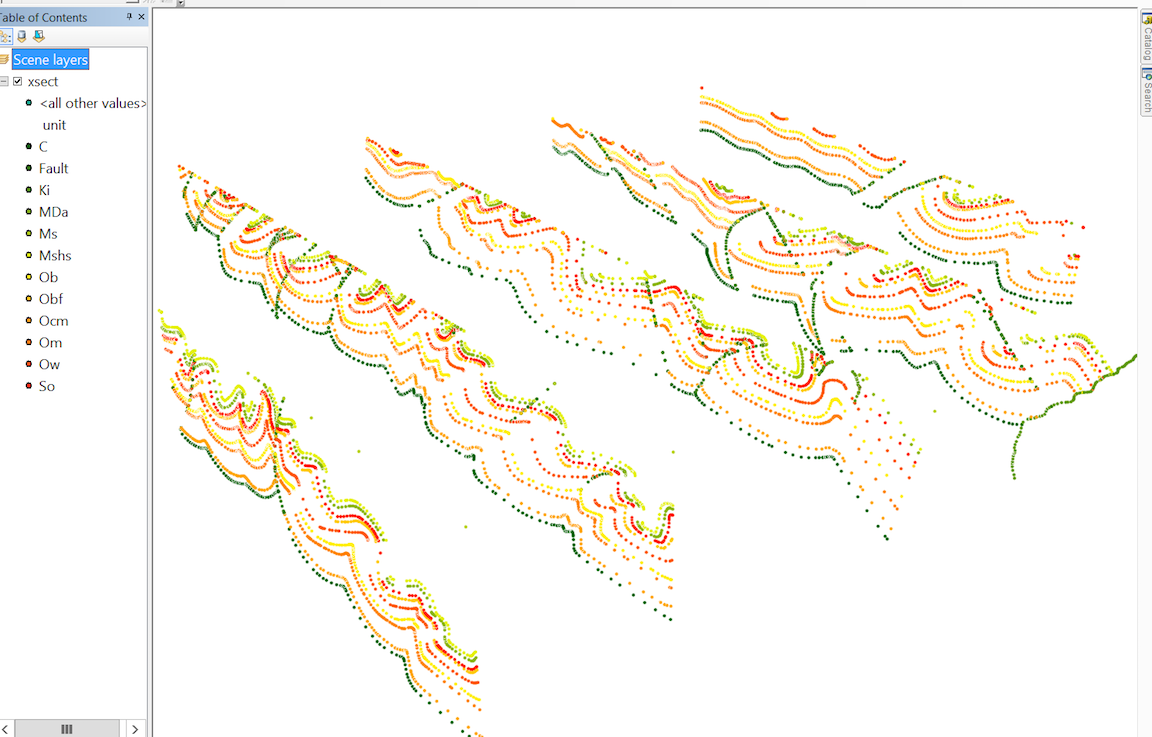
From there, a short script can extract the vertices from the lines, and using the corners, we could transpose the points for display in 2D or 3D space - (note in 2D - all points stack on top of each other in the vertical plane)

3d points display in 2D

or in some 3D viewer -

enter image description here

while we didn't store these in a database, the concept should be the same.

now, perhaps there is some huge blunder in our method - so i'd be happy (well, not really) to hear that as well. if interested, i could share the kludgy script we used to transpose the data.

7
  • I think that's pretty much the approach we currently have as well. Apart from the scripts which indeed sound interesting but this question is mostly about data storage. Commented Dec 19, 2015 at 12:35
  • in this instance, the previous CRS for the study area was in UTM. we maintained that for the vertical rasters. Of course, you can add vertical exaggeration - just need to account for it in the transposition. Commented Dec 19, 2015 at 12:36
  • 1
    i'm sure i'm not thinking of this with enough metrics - to 'encode the z coordinate of the wall as x, and the offset from the left side of the wall as y' - seems opposite of how we stored it? for my simple mind, it was easy to place the base of the wall-raster exactly where it should be on the map - and in 2D it would be as if it had fallen flat on the ground. All in the same CRS? Commented Dec 19, 2015 at 12:50
  • no, that's actually a typo in my question :) Commented Dec 19, 2015 at 14:17
  • realized I had not completely answered your question. Yes, it's all in the same CRS close to the origin (x: close to 0 / y, around altitude of the site). So to see the rasters instead of the map we just use "zoom to layer extent". The nice thing about it is that in the print composer a horizontal grid will denote the altitude. Commented Dec 22, 2015 at 8:53

Your Answer

By clicking “Post Your Answer”, you agree to our terms of service and acknowledge you have read our privacy policy.

Not the answer you're looking for? Browse other questions tagged or ask your own question.