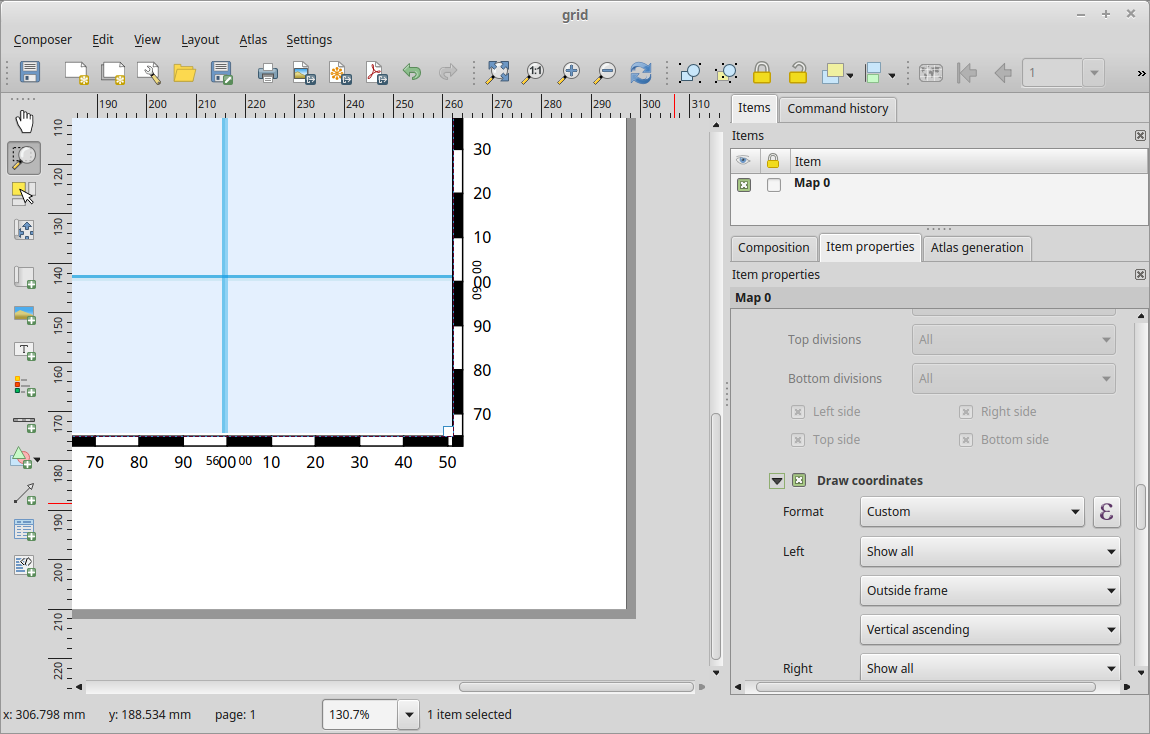
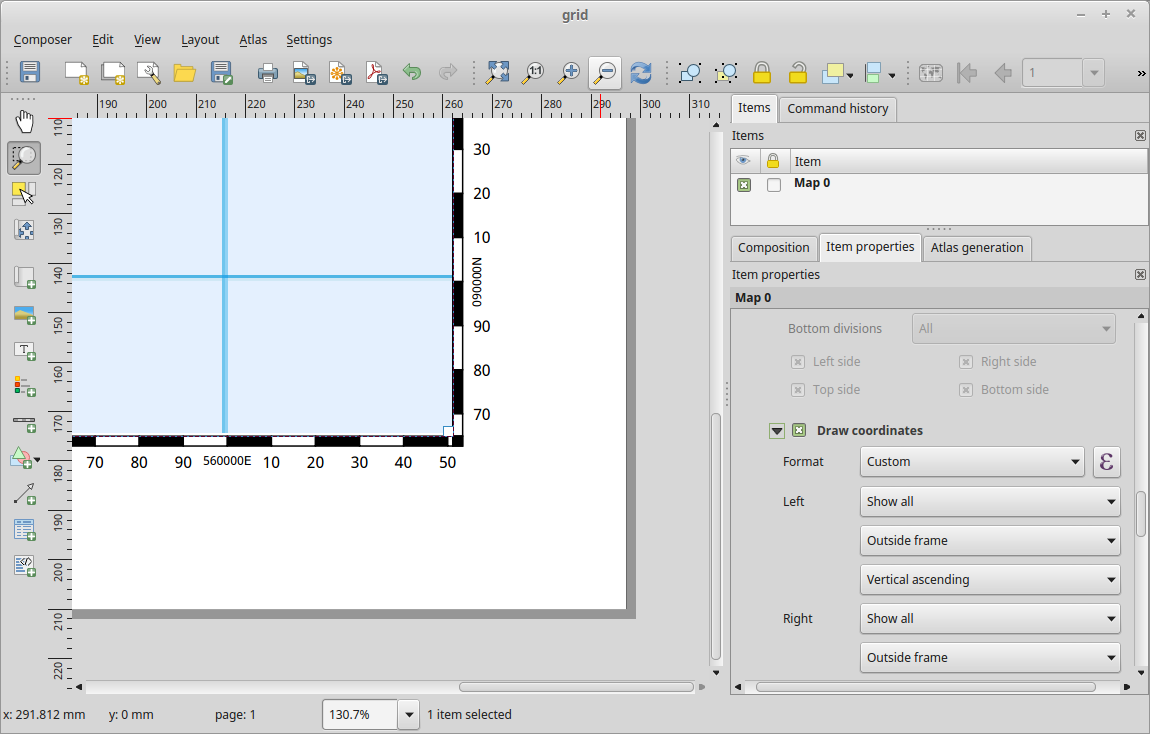
Klas's answer seems correct to me but it does make some assumptions about the size of the coordinates that may fail.
I've created the same solution using the following expression:
CASE WHEN  @grid_axis = 'x' THEN
' ' ||  left(lpad( @grid_number ,6,'0'), 2) ||'      '||right( @grid_number ,2)
ELSE
'  ' ||  left(lpad( @grid_number ,6,'0') ,2) ||'    '||right( @grid_number ,2)||' '
 END
I was unable to get the spacing quite right using a single line of text so I went for one line for the X axis (1st one) and one for the Y axis.

The main trick here that isn't spelt out in Klas's answer is that you need two grids - one at 1000m intervals with an expression
substr( lpad( @grid_number,6 ,'0'), 3,2)
to draw the middle digits (at font size 9) and the second formatted as above with font size 7 to draw the beginning and end of the 10000m grid lines.
I suspect the true cartographers will spend more time with fonts and spacing to make it look even nicer than this.
Alternatively you could change the lower grid to not show anything at the 10000 lines by using:
CASE WHEN  @grid_number %10000 = 0 THEN
 ''
 else
 substr(  lpad(  @grid_number,6 ,'0'), 3,2)
 END
and print the whole grid number at those lines.


