11

I've millions of points collected for lithology layer.

They have used a coding for different types of rocks.

I need to create a polygon around the extent of similar points.

What is the easiest way to get the polygon rather than digitising manually.

I was searching for tools that convert points to polygons but looks like there arent any.

I've seen tools for converting line to polygons, polygons to lines and points but not for points to polygons.

11
  • 4
    Please see the moderator comment to your previous question. When you follow the rules, people appreciate it and are more likely to offer quick replies when you really need them.
    – whuber
    Commented Feb 8, 2012 at 23:26
  • Is your problem "I need to create a polygon around the extent of similar points"? Try rectangle( point(min(x),min(y)), point(max(x),max(y)) ) ... or be more specific. Commented Feb 9, 2012 at 0:13
  • what environment are you in? Commented Feb 9, 2012 at 1:18
  • It sounds like you want a convex hull function. If that is what you are looking for, this question has already been addressed.
    – hailes
    Commented Feb 9, 2012 at 1:43
  • Try "make one polygon from points" of "XToolsPro" in arcgis Commented Feb 9, 2012 at 13:36

5 Answers 5

22

We need to bear in mind that these data are samples of discrete lithologic domains. Often, the boundary between two such domains cannot be identified in the field and so it's not valid to expect that many of the sample locations will lie precisely along boundaries. A correct solution will be a partition of the study area and each polygon within that partition could (and often will) extend beyond the locations of the samples that determine it. Except for crude approximations, this rules out any approach that uses the sample locations as vertices of the resulting polygons.

For high quality work, the best method is to fit a generalized linear spatial model for a multinomial process. That's a procedure that requires considerable expertise and effort. As a substitute, you might consider expanding each sample point into its polygon of influence (aka Thiessen polygon, Voronoi polygon, or Dirichlet cell). Limiting the expansion to land areas is a good idea; this can be done with a mask grid.

To illustrate, consider this much smaller dataset (of 14,136 points) representing 12 lithologic classes as distinguished by color:
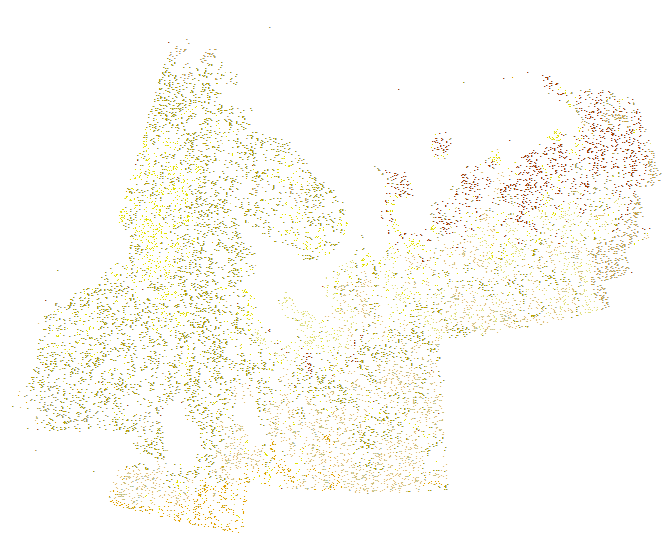
Samples

Here is a detail from the center of the eastern lobe, showing the irregular positions of the points and the relatively rapid changes of lithology there. Tracing this manually would be a difficult and arbitrary procedure:
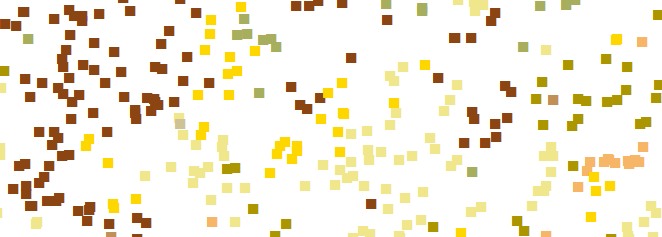
Samples--detail

I accomplished the expansion by converting these points into a grid (around 800 rows and 1000 columns) and computing their Euclidean allocation, using a mask that limited the calculation to non-glaciated land. (The color scheme in the next two figures differs from that of the preceding one.)
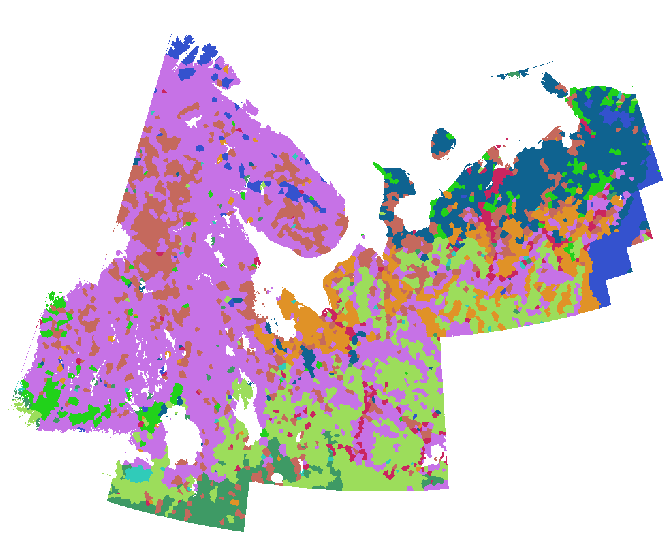
Euclidean allocation

For comparison, here is a detailed lithologic map of the same area drawn to the same scale with the same symbolization:
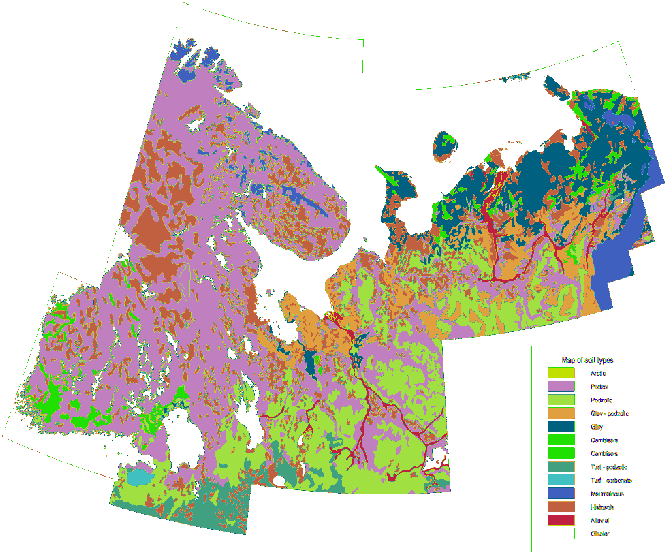
Original map

With a truly large dataset or a convoluted study area, it may be expeditious to tile the region and perform this procedure separately on each tile, mosaicing the results into one output raster if desired. For this to work, the tiles need to overlap slightly to avoid edge effects (and then should be uniformly trimmed before mosaicing).

The principal reasons for going to a raster representation are (1) it's quick and easy to compute and (2) accurate vector-based solutions will be hard to come by. If you try buffers, convex hulls, concave hulls, or whatever, you will find that they all mutually intersect and they still leave gaps: in other words, they won't produce a topologically consistent partition of the space into distinct lithological domains.

One vector-based method that will work is to compute a constrained Voronoi tessellation of the points (good methods take O(n*log(n)) time for n points), spatially merge the Voronoi cells according to the lithological attributes of their associated points, and then separate the resulting multi-polygons into their connected components (if you wish). However, if all you need is vector output, it's easier to regiongroup the raster result and convert that to vector format.

6
  • Thanks for giving a nice explanation let me try doing something similar to this. Thanks a lot Commented Feb 9, 2012 at 18:34
  • how did you created the grid, i'm lookin in for tools which converts points to grid. Thanks Commented Feb 9, 2012 at 18:53
  • I saved the points as a grid. This procedure initializes each cell with NoData and then updates the cells that contain points with the point attributes: no interpolation is involved.
    – whuber
    Commented Feb 9, 2012 at 20:29
  • Can you specify the tool you used for saving the points to grid. I'm sorry for bothering you but I'm really poor at raster analysis. Thank you again. Commented Feb 9, 2012 at 23:25
  • Please follow the link in my previous comment to the help page.
    – whuber
    Commented Feb 10, 2012 at 0:16
3

The ESRI Resouce Center has a tool to create a "Concave Hull". This might produce a polygon that conforms better to the edge of your points compared to a Convex hull. The input is a point feature class and produces a polygon.
Concave Hull Estimator

3

You could try creating Thiessen Polygons from the points and then dissolving the resulting polygons using the rock type attribute.

7
  • I discuss this solution at the end of my reply: Thiessen polygons are synonymous with a Voronoi tessellation. Thanks for providing a link to the software!
    – whuber
    Commented Feb 9, 2012 at 18:30
  • 1
    The listed thread requires an ArcInfo license, if you have an Arcview license, then you can try resources.arcgis.com/gallery/file/geoprocessing/…
    – user681
    Commented Feb 9, 2012 at 18:48
  • I would be very interested, @Dan, to know how well your solution handles "millions of points." :-) It can be a pain to generate a dataset that large purely for testing; so, Ramakrishna, if you do try either of the vector solutions mentioned here, would you be so kind as to tell us about their performance afterwards?
    – whuber
    Commented Feb 9, 2012 at 20:26
  • 1
    _@Bill, I didn't take offense, term precludes an assessment a present but it is now a sticky note on my monitor :) I will report much later. In the interim, anyone with an ArcInfo license could report Arc's implementation times for point files of various sizes so I could compare the pure Python implementation to it. Regards
    – user681
    Commented Feb 9, 2012 at 22:02
  • 1
    @whuber The tools from the ArcGIS didn't consumed much of time for processing 28 million records. It was quicker in reading the points and processing them to the grid and then to Euclidean Allocation. I really appreciate for taking time and posting your answers on the blog. Thank you again. Commented Feb 13, 2012 at 19:30
2

3D Interpolation to build solids then horizontal section slice at depth to cut through the lithology to obtain polygon - Based on you latest comments it seems that we are dealing with 3D drillhole data. This means that you will have to first build 3D solids (triangulated meshes) from your data. There are 2 ways of doing this: Digitizing the contacts in 3D space to create the lithology solids or 3D interpolation. To do it manually you will need software such as GEOMCOM GEMS or similar and the only package I know that can do this dynamically is Leapfrog Mining. (Which is what I use) The manual models tend to be simpler and allow for human interpretation of the geology but updating is difficult. The dynamic models can take some time to setup but as your programs moves along and new data becomes available you can simply update and regenerate updated lithology models. Both techniques are quite complex to explain here. I would probably recommend to digitize manually for simpler models or where you will not be updating the model with new data down the road. Leapfrog Mining is a really well polished application and it has an entire 3D domain structure in which you can define Lithology correctly from oldest to youngest for example but it requires training to grasp this concept.

Once you have your Lithology model created it's simply a matter of creating a horizontally oriented section slice at a specific depth. You can then export the outlines of the lithology to polygons which forms the basis of your lithology map. You can lower the slice several times at an interval to then compare how the lithology changes at various depth.

This can be visualized in Leapfrog as well but I often export the 3D models to DXF and use other applications such as Geosoft Target to create more traditional sections using these solids.

I only described my workflow but i am sure there are other solutions; it is possible to generate a Lithology model in Geosoft Target but I have not tried simply because I do not enjoy working with this software. I am pretty sure Datamine Studio can also be use or may even be superior to my techniques.

-1

You could try using the Buffer Wizard in ArcMap.

You can try and use any kind of metrics or distance but you probably need to figure it out to match or maybe using it's extent template if there is one.

You might want to find it in ArcScripts or geoprocessing from ESRI Support website.

Your Answer

By clicking “Post Your Answer”, you agree to our terms of service and acknowledge you have read our privacy policy.

Not the answer you're looking for? Browse other questions tagged or ask your own question.