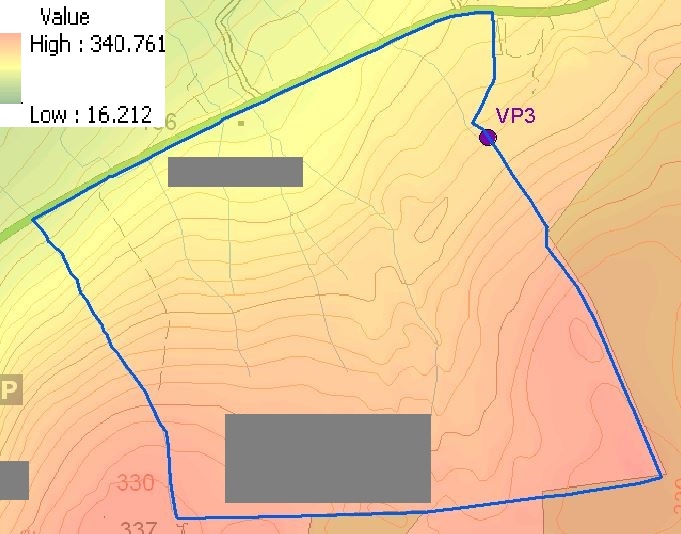
I have an observer point (VP3) from which a consultant viewed bird activity on a site. See illustration of the site (blue polygon) with a colored scale of terrain height AoD in m (grey rectangles added before posting and should be ignored):
It is necessary to provide an illustration of what area is visible from VP3 in order to show what bird activity the consultant could have observed.
In doing so the following are assumed:
(1) The consultant was 1.8m in height.
(2) The observer was looking for birds flying up to 20m above the ground.
It was decided to use the Viewshed (Spatial Analyst) tool. However (2) above requires a change to the input raster. This was achieved by using raster calculator to create a new raster = Terrain Raster + 20m. This raster was checked and appears correct.
Viewshed was then run with the following:
Input raster: Raster output from raster calculator = Terrain height + 20m
Input point or polyline observer features: A point feature class VP3 only.
Output above ground level raster (optional): Not entered.
Z factor (optional): not entered
Use earth curvature correctional (optional): FALSE (not checked).
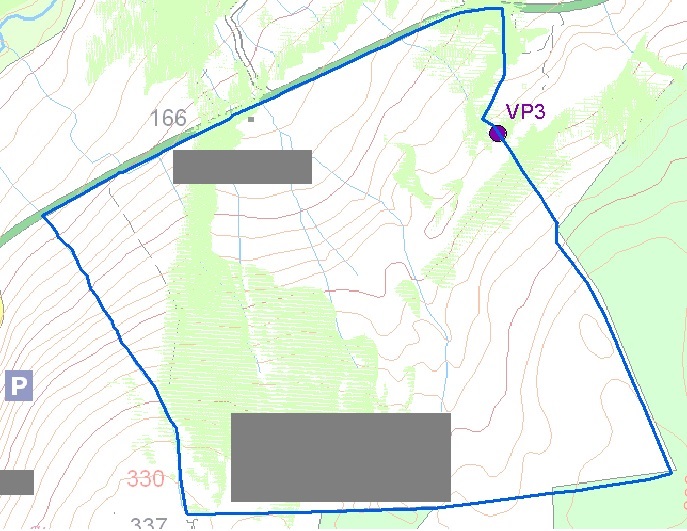
The output is not as expected:
The pale green represents areas that are visible. Referring back to the picture showing terrain across site, there is a gradual slope from high altitude to lower altitude from South to North of the site. Given the lack of hills in between the viewpoint and the area of interest (within blue line) it would be expected that almost all of the site would be visible.
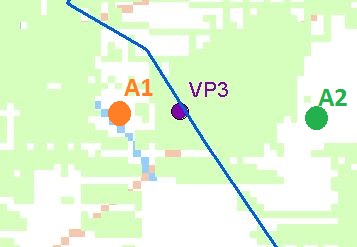
To illustrate this further, the area directly around VP3 is investigated. See VP3 and two points, A1 and A2:
Altitude has been obtained using the Identify tool:
A1: 238m VP3: 240m A2: 242m
Distances: A1 -> VP3 = 31m. VP3 -> A2 = 100m.
Considering the observer height of 1.8m and that features 20m above the ground are being observed, it is not feasible that A1 and A2 would not be visible from VP3.
What is the error in my understanding or my approach?


