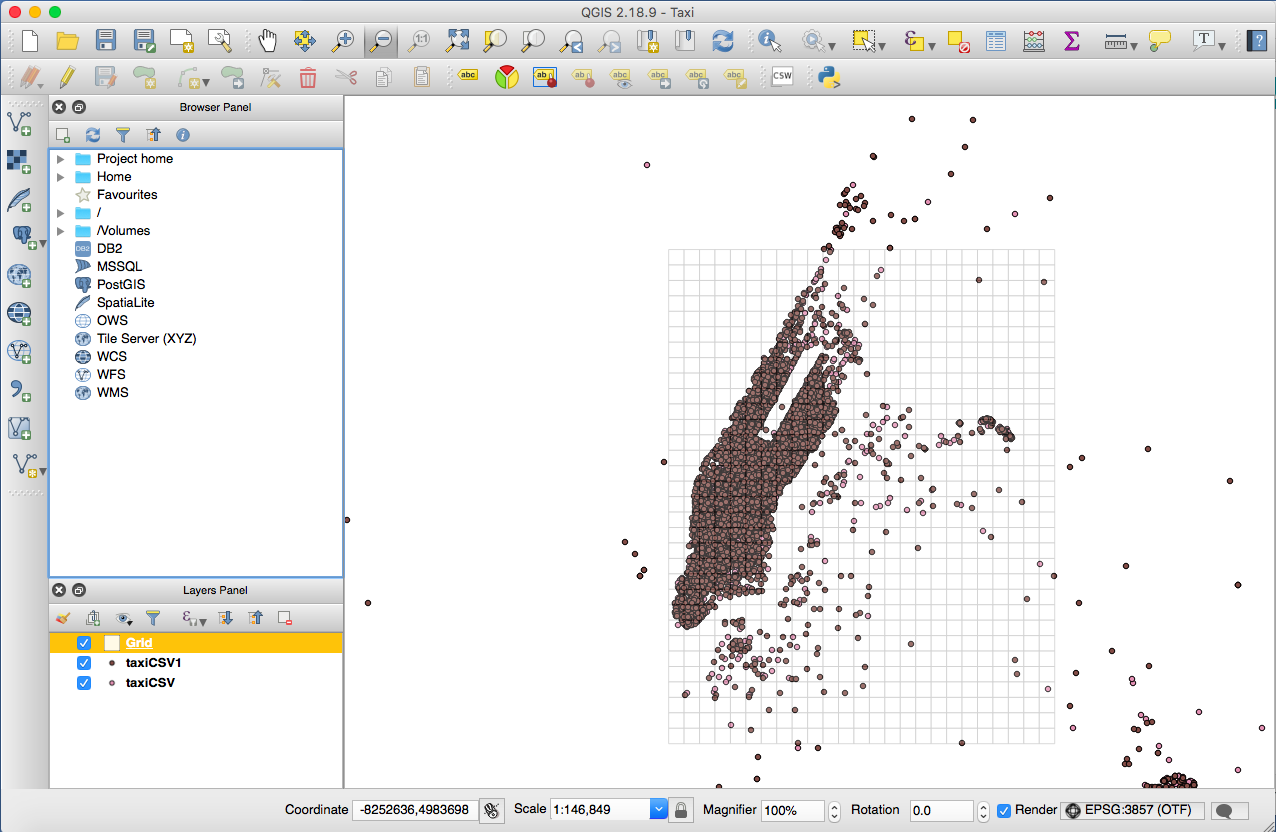
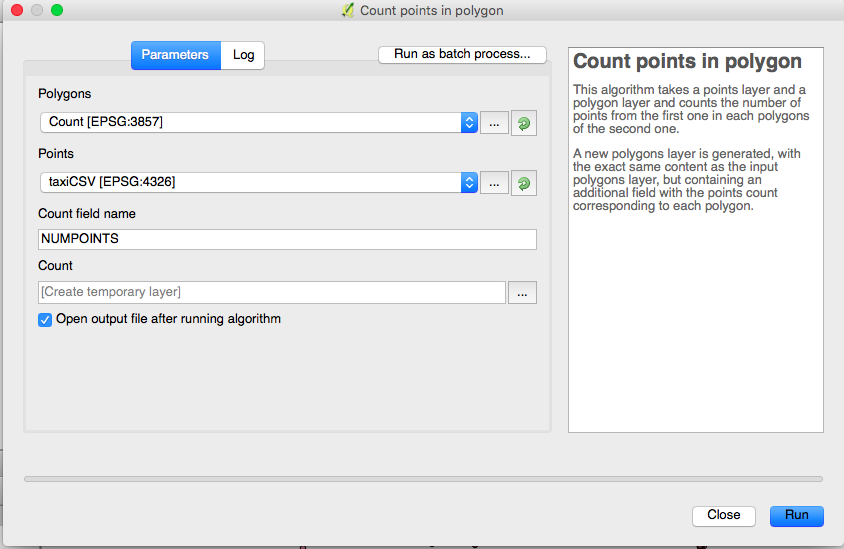
I just recently started learning QGIS. I have a csv file with 10,000,000 entries detailing every yellow taxi trip taken in New York City in December of 2015. I want to create a trip distribution matrix with this data. I began by plotting the first 10,000 entries' pickup and drop-off longitude and latitude points for a total of 20,000 points. I then created a vector grid (.5 x .5 miles) in order to function as the zones for my trip distribution matrix. Then I tried the count points in polygon function in the vector analysis menu but the count comes up 0 in every row. Any idea what I am doing wrong?
1 Answer
I think you are using different projections. It looks like the CSV file is in WGS 84 and and the grid is in WGS 84 / Pseudo Mercator projection. In order to have the Points in polygon tool works well you need to unify the projections into one projection. In other words, you need to change the projection of one of them into the other.
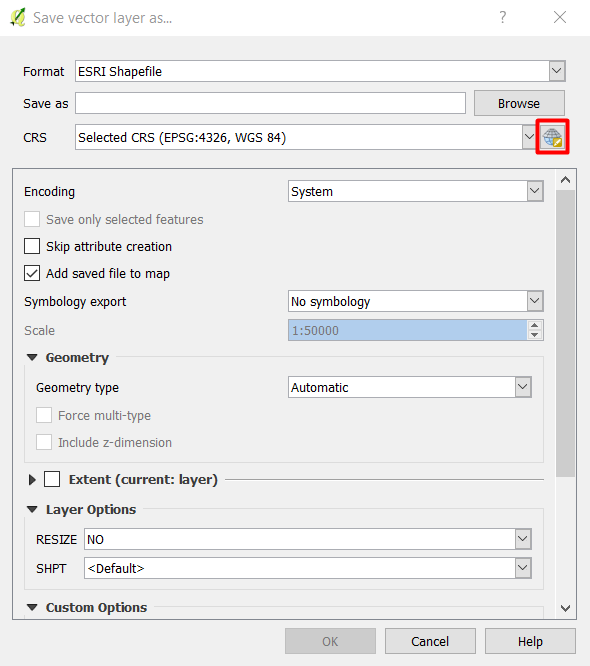
If you want to use WGS 84, then you need to right-click the grid shapefile -> Save as -> CRS and select the WGS 84:


