1

I have used the R Project for Statistical Computing to make a map of clusters based on latitude and longitude by using the k-mean clustering.

Is there any software I can use to import the clusters into a map and draw boundaries between the cluster to create regions?

Also, for further analysis, I have some more data points.

Is there any software which I can use to identify which regions the data points (lon, lat) belongs to?

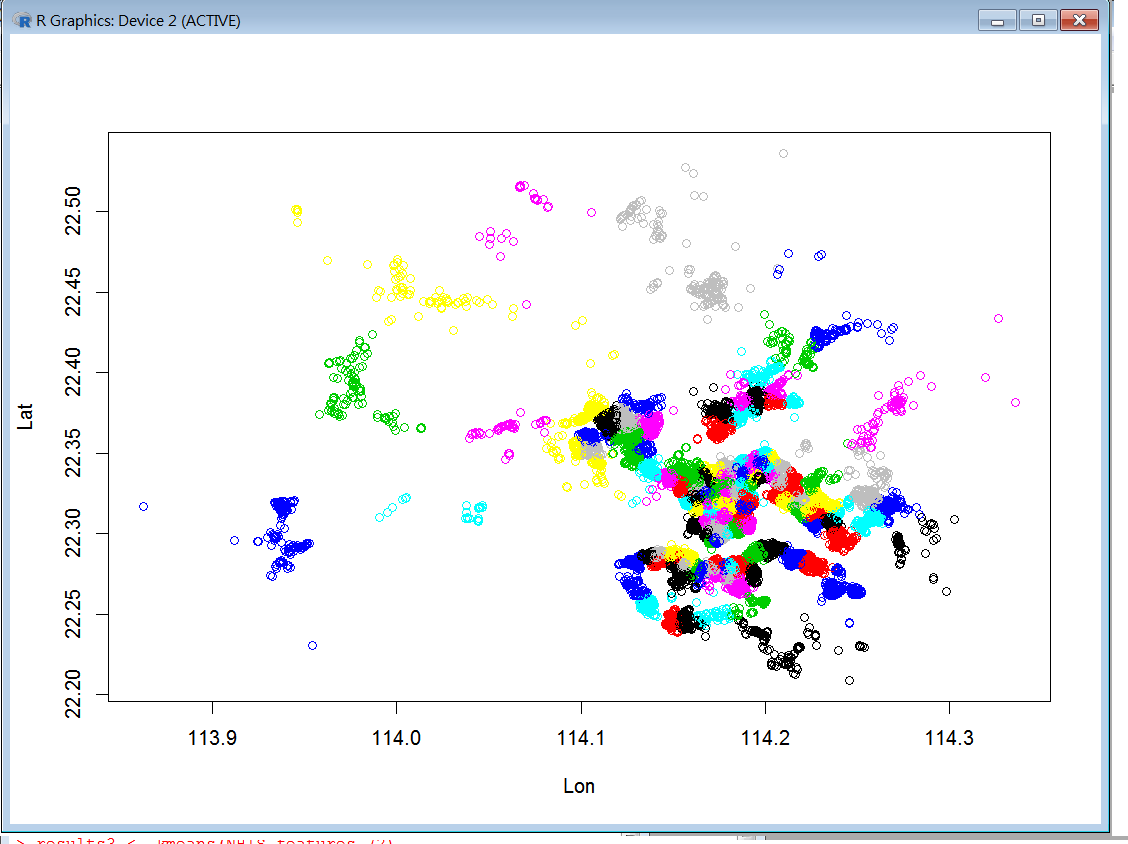
cluster

1 Answer 1

1

Kmean separates the clusters based on Euclidian distance to centroids, so if you keep this logic you are looking for a Voronoi like algorithm around the centroids (mean lat and mean long) of each cluster. This can be done with most softwares, here are 2 examples:

QGIS/GRASS: see Is it possible to create Thiessen polygons around nodes in QGIS?

ArcGIS : The drawing of Thiessen/Voronoi polygon boundaries - are the bisecting lines truly perpendicular?

Note that you can also create such Voronoi map (not a cartographic map) within R: http://letstalkdata.com/2014/05/creating-voronoi-diagrams-with-ggplot/

Your Answer

By clicking “Post Your Answer”, you agree to our terms of service and acknowledge you have read our privacy policy.

Not the answer you're looking for? Browse other questions tagged or ask your own question.