11

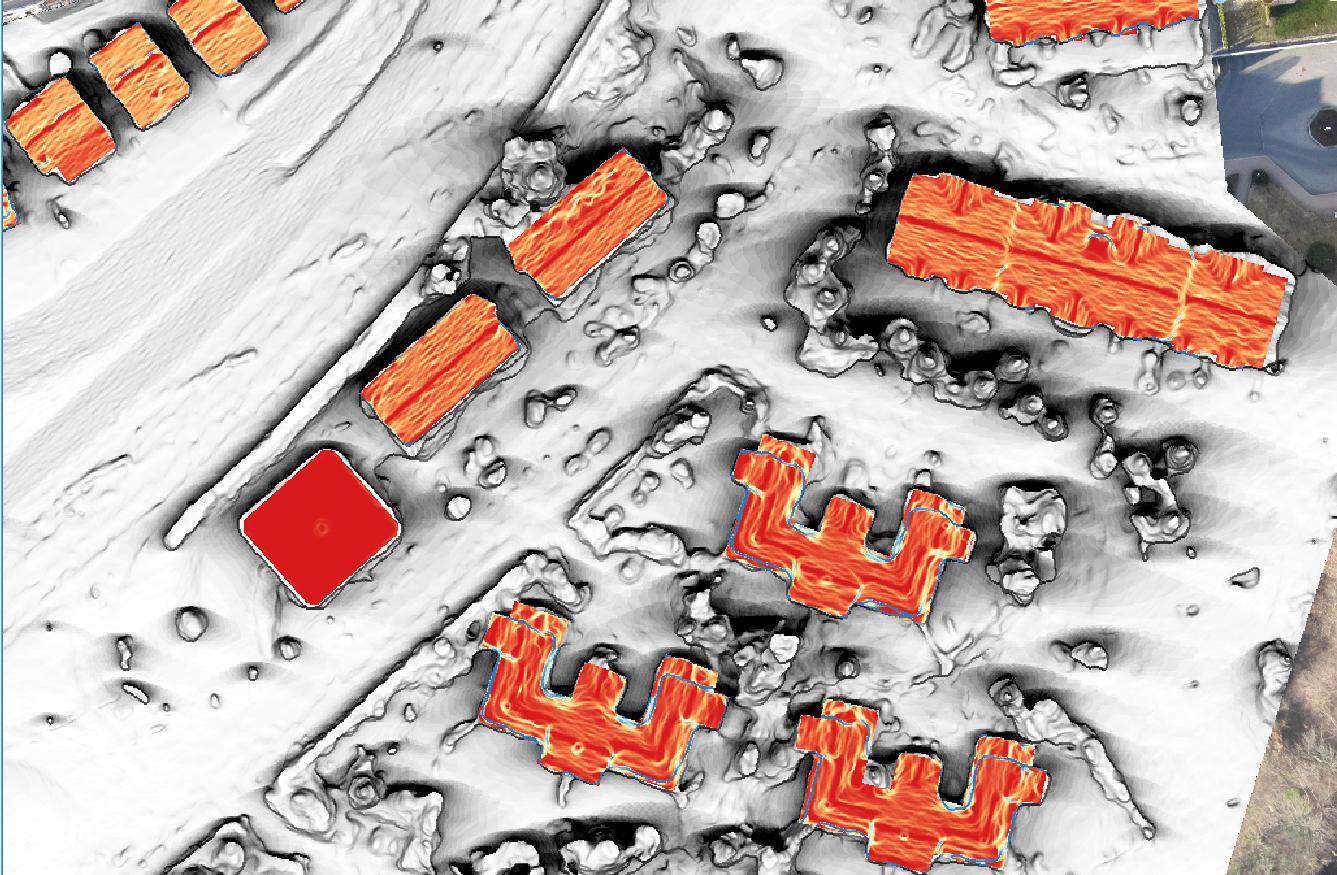
I want to calculate total PV potential of a roofs in a certain area. To do that I made a dsm, ran SAGA "Potential Incoming Solar Radiation" algorithm (just playing with it only for now - I need to work out how to obtain proper values) and cut the output raster to vector with a roofs outlines.

As a result I received nicely cut raster that fits to size of each roof, as visible on image below.

enter image description here

What tool should I use to obtain exact value of irradiance for area of individual roofs?

To be more accurate: not only visualize distribution of irradiance on the roof but exact number of kWh/sq m for given area?

1
  • 1
    Without putting a lot of thought into it, I think you may be looking for "Zonal Statistics". It is under the Raster menu in QGIS. Commented Nov 29, 2017 at 19:16

2 Answers 2

9

Have a look at this tool: SEBE (included in the UMEP toolkit, which has recently been added to the QGIS official plugin repository). As described in the official site, SEBE (Solar Energy on Building Envelopes):

... can be used to calculate pixel wise potential solar energy using ground and building digital surface models (DSM). SEBE is also able to estimate irradiance on building walls. Optionally, vegetation DSMs could also be used. The methodology that is used to generate irradiance is presented in Lindberg et al. (2015).

3
  • 1
    I heard about the UMEP earlier but had no chance to test it. Thanks for this suggestion. In the introductory movie seen on YT I've seen that it may be necessary to work with two types of DSMs - ground + buildings and vegetation. Would it not be a problem to use only one where all objects (buildings, plants) are present?
    – proteus
    Commented Dec 2, 2017 at 10:23
  • 1
    @proteus, Adding vegetation is just an optional. You can use the tool only including a ground and building DSM. There is a tutorial available from the website if you like to try SEBE out (urban-climate.net/umep/UMEP_Manual#Tutorials).
    – sunt05
    Commented Dec 3, 2017 at 9:13
  • here is the updated link for the tutorial: tutorial-docs.readthedocs.io/en/latest/Tutorials/SEBE.html#sebe
    – MrXsquared
    Commented Nov 4, 2019 at 15:26
8
+50

I've not used the PV tool and don't know the units on the raster, but can give you a general idea for one way to accomplish this.

  1. Generate the raster, as you have done (don't necessarily need to clip to polygons yet if you don't want to). It may be easier to do the math using a 1m x 1m raster size so each cell is 1 square meter, assuming this isn't too coarse for your evaluation. If you need something finer, perhaps 0.316 m x 0.316 m would work to give you an area of ~0.1 square meters. Make sure you are working in a projection with appropriate units. Pseudo-Mercator EPSG 3857 used by Google, OSM, websites, etc. is NOT appropriate for this. Units are in meters, but they are distorted as you move toward the poles. If you are in the U.S., a state plane system may work, or else a UTM system could be appropriate anywhere.

  2. Determine the units on the raster cell values. Then figure out the math to calculate kWh per cell. If each cell is 0.1 sq m, don't forget to divide by 10 (or appropriate conversion based on cell size). You can then use the raster calculator in QGIS raster menu to create a raster where each cell has its kWh potential (the "/sq m" part of the noted "kWh/sq m" units is now represented by the cell size). There is also a raster calculator in SAGA (available in QGIS Processing Toolbox) if you prefer it.

  3. Using the new raster and your building polygons, run the Zonal Statistics tool in the QGIS Raster menu. Check the boxes you want for each roof polygon, most importantly the "sum". You should end up with a vector layer where each polygon has an attribute representing the sum of all the raster cells intersecting the polygon. This will give you kWh potential per roof. If you want particular areas of the roof, you will need to have smaller polygons.

It won't take a lot of modification to the steps above to do related calculations, such as calculating kWh/sq m values for each cell, and then get mean and/or median values of all cells within a polygon using the Zonal Statistics tool.

2
  • Thanks @Nate Wanner! Sounds really promising. I'll check how it works as soon, as possible. One question though: is Zonal Statistics tool the only option for this? Field Calculator cannot be applied to achieve the same?
    – proteus
    Commented Dec 2, 2017 at 10:17
  • 2
    Field calculator provides calculations on vectors (polygons). Raster calculator provides calculations on the raster (grid cells). The Zonal Statistics tool is what allows you to make calculations of raster values summarized by building (polygon). Commented Dec 2, 2017 at 16:55

Your Answer

By clicking “Post Your Answer”, you agree to our terms of service and acknowledge you have read our privacy policy.

Not the answer you're looking for? Browse other questions tagged or ask your own question.