I wish to display a map in QGIS (world country shapefiles) showing all countries but centered on the Pacific area.
I am not familiar with Proj4, so is there any way this can be done in QGIS?
I wish to display a map in QGIS (world country shapefiles) showing all countries but centered on the Pacific area.
I am not familiar with Proj4, so is there any way this can be done in QGIS?
Well, not that easy, as QGIS does not come with predefined Robinson or Miller projections.
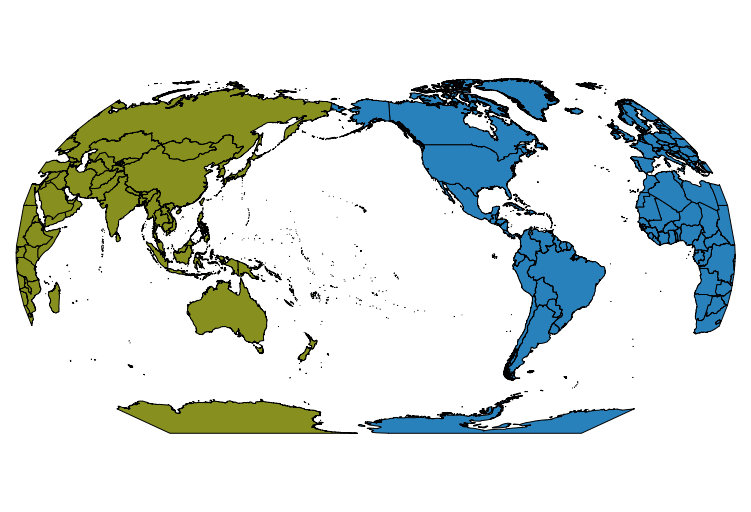
So I tried a Custom CRS and got this picture (not in first run!):

For a central meridian at 150° West, it is necessary to split the world boundaries shapefile at 30° East (to be precise, at 29.9 and 30.1 to avoid intersections)
So these are the steps:
Save As ... into WGS84, and add that to the canvasOn-the-fly-projectionNr;WKT
1;POLYGON((30.1 89, 29.9 89, 29.9 -89, 30.1 -89, 30.1 89))
Text delimited layer, using semicolon as separator and WGS84 as CRS (you will get a very thin polygon around 30°E)Vector -> Geoprocessing -> Difference with the two polygon layers+proj=robin +lon_0=-150 +x_0=0 +y_0=0 +ellps=WGS84 +datum=WGS84 +units=m +no_defs
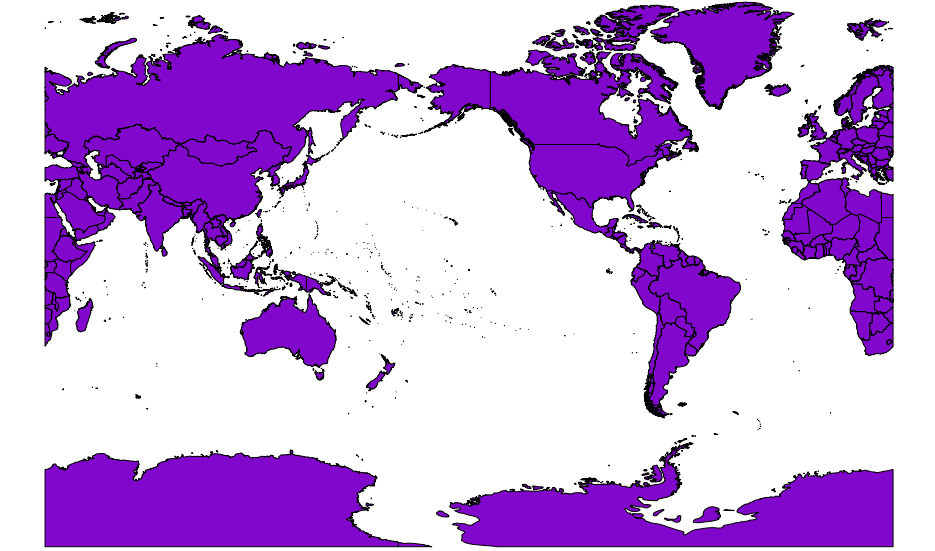
On-the-fly projection and choose Robinson as project CRSFor the Miller projection, you can use the same pre-cut shapefile. In Proj, Miller has some problems with the ellipsoid, so we take a sphere instead (you won't see a difference):
+proj=mill +lon_0=-150 +lat_0=0 +R=6371000 +units=m +no_defs
With on-the fly activated, it does not look as well, New Zealand is missing at full extent, but returns when zooming in. So we need to Save As ... the shapefile in miller projection, and show only that, without on-the-fly reprojection:

Settings > Custom CRS...
Commented
Dec 9, 2015 at 0:14
QGIS comes ready supplied with everything you need (i.e. it handles Proj4 for you under the hood). If your data are already in the projection you want, then right-click the layer and choose "Set Project CRS from Layer". This will put the data view into the same projection as your data. You will probably have to also right-click your layer and choose "Zoom to Layer Extent".
If your data are in some other projection, you can either reproject on the fly (in project properties) or reproject the data itself by right-clicking your layer and choosing "Save as". When the save dialog box opens, select the CRS for the output dataset and then use the new reprojected dataset.
In transformations of cylindrical data sources crossing 180 meridian, I would recommend using the virtual composite. It achieves the goal with a single ogr2ogr command processing a split source file. This method is very efficient and allows precise calibration of shape segmentation parameters to avoid intersection errors. Of course, a VRT file can be loaded in pipeline mode.
<OGRVRTDataSource>
  <OGRVRTUnionLayer name="source">
    <OGRVRTLayer name="world-a">
      <SrcDataSource>/vsizip/world.zip</SrcDataSource>
      <SrcSQL dialect="sqlite">SELECT ST_Segmentize(ST_Intersection(geometry, BuildMBR(-179.99,-90,29.99,90)),.1) AS geometry FROM "world"</SrcSQL>
    </OGRVRTLayer>
    <OGRVRTLayer name="world-b">
      <SrcDataSource>/vsizip/world.zip</SrcDataSource>
      <SrcSQL dialect="sqlite">SELECT ST_Segmentize(ST_Intersection(geometry, BuildMBR(30.01,-90,179.99,90)),.1) AS geometry FROM "world"</SrcSQL>
    </OGRVRTLayer>
  </OGRVRTUnionLayer>
</OGRVRTDataSource>
ogr2ogr -a_srs EPSG:4326 -s_srs "+proj=latlong +pm=150" -t_srs "+proj=robin" -dialect SQLITE -sql "SELECT ST_Union(geometry) FROM source" world.shp world.vrt
or
type world.vrt | ogr2ogr -a_srs EPSG:4326 -s_srs "+proj=latlong +pm=150" -t_srs "+proj=robin" -dialect SQLITE -sql "SELECT ST_Union(geometry) FROM source" world.shp /vsistdin/
An example of a multi-layer vector composite created using the above-mentioned method with the central meridian 100W.