I am attempting to create multiple watershed delineations for stations within a CSV file. I have files for flow direction (raster with a cell size of 30m), flow accumulation(raster with a cell size of 30m), and stream networks (line vector) and have snapped my points to the stream networks. Then visually checked that they do land exactly on cells with very high accumulation. Then I exported the points to a CSV file with the first column being Station ID's and the 3rd/4th column long/lat coordinates.
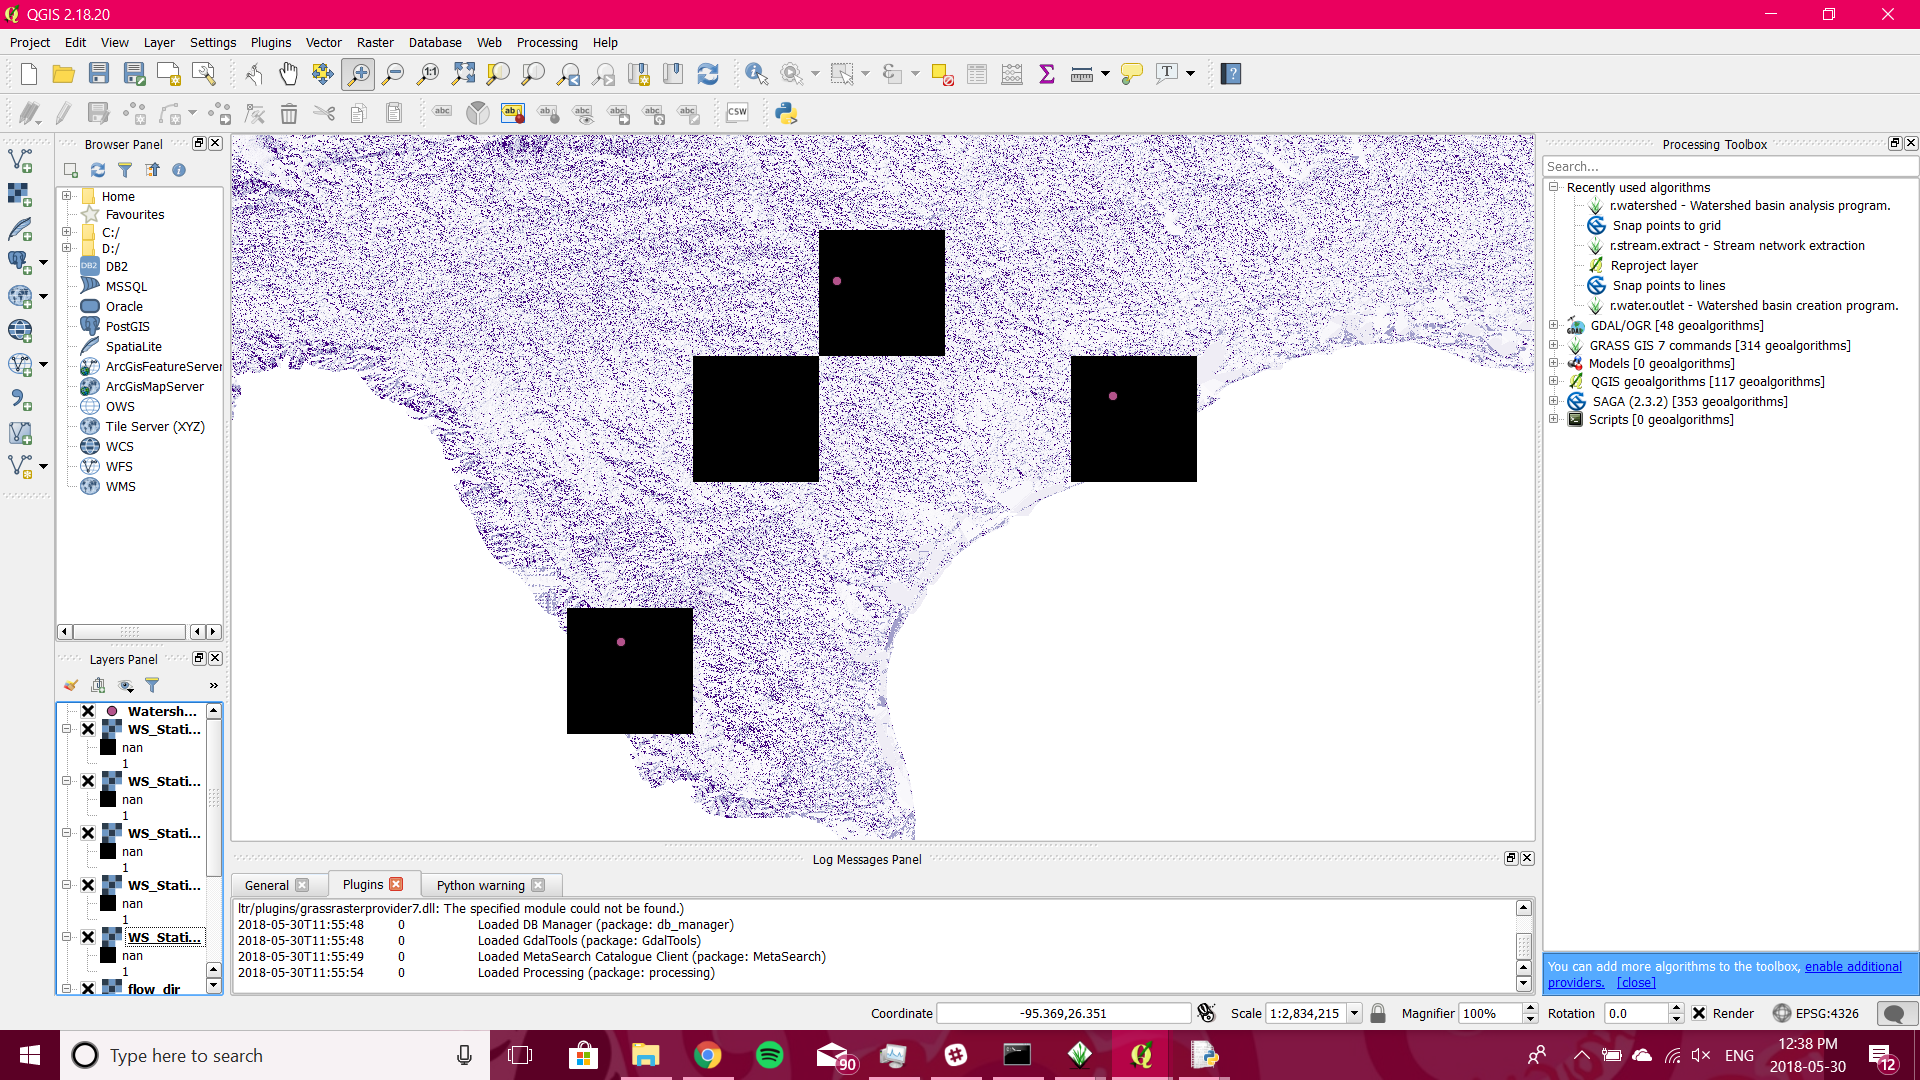
From there I created a loop as per this thread. but my results are coming out funny. (Screen shot below)
Each one of those black squares is not a single cell. It's 100's of columns/rows all with non-values. The extent is nowhere near as large as the delineated watershed was supposed to be so I don't think the actual delineation is within these squares.
I can't change the color of these output squares but here are an example of three of my "delineated watersheds"

This is my python script - I run it in GrassGIS and open the results in QGIS:
import os
import sys

#set up GRASS environment variables
os.environ['GISBASE'] = "C:\\Program Files\\GRASS GIS 7.4.0"
sys.path.append(os.path.join(os.environ['GISBASE'], 'etc', 'python'))

import grass.script as g
import grass.script.setup as gsetup
sys.path.append(os.path.join(os.environ['GISBASE'], 'etc', 'python'))
gisbase = os.environ['GISBASE']
gisdb = "D:\\nicol\\Documents\\grassdata"
location = 'newLocationNAD83'
mapset = 'PERMANENT'
gsetup.init(gisbase, gisdb, location, mapset)

g.run_command("r.in.gdal",
                input="D:\nicol\Documents\grassdata\\flow_dir_NAD83",
                output="Test_WS",
                flags="oe")

g.run_command("g.region", rast = "Test_WS", flags = "p")

#csv file reading and importation
import csv
rows = list(open("D:\\nicol\\Documents\\grassdata\\WatershedDelineation.csv"))
totalrows = len(rows) - 1

#loop through the csv(coordinates) file in r.water.outlet module
#i = start row
#j = start column
f = open("D:\\nicol\\Documents\\grassdata\\WatershedDelineation.csv")
element = list(csv.reader(f))
i = 1
j = 2
flow = "Test_WS"
basin= "WS_Station_"

while True:
    if i <= totalrows:

        g.run_command('r.wateroutlet.lessmem',
                        input = flow , output = basin + str(element[i][j - 2]),
                        coordinates = element[i][j+1]+","+element[i][j] )

        g.run_command('r.out.gdal',
                        input = basin + str(element[i][j - 2]),
                        output= "D:\\nicol\\Documents\\USA_Watersheds\\WS_Station_"+ str(element[i][j - 2])+".tif",
                        format= "GTiff",
                        type= "Float32" )
        print "Station "+str(element[i][j-2])+" Complete"
        i = i + 1

    else:
        break

coordinates=parameter should beelement[i][2], element[i][3].r.in.gdalat the beginning. Isn't the flow_dir_NAD83 already a GRASS flow direction raster?g.region -p,g.proj -p,r.info Test_WSand the first few lines of your CSV fileWatershedDelinieation.csv??