0

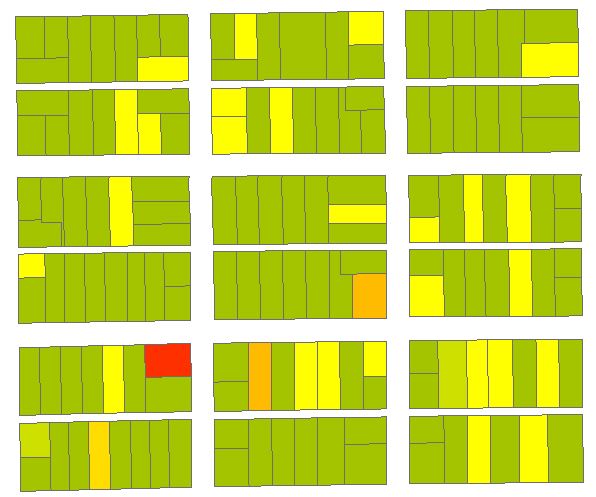
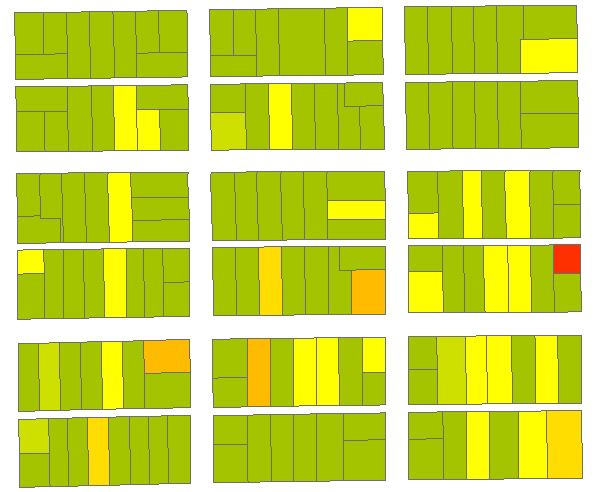
I have two polygon layers, one from 2015 and the other from 2018. Each layer has an attribute field with a number from 1-14 which describes the physical conditions of houses. There are 15,000+ houses in each layer.

What I'd like to do using ArcMap is to create a map that answers the following question:

Are the housing conditions in 2018 better, the same, or worse than 2015?

Image below: YEAR 2015

enter image description here

Image below: YEAR 2018

enter image description here

3
  • 1
    What exactly are you trying to ask? Are the housing conditions better for particular residents? For sections of the area? Or on average for the area as a whole? It's not very clear what you're trying to achieve from your question.
    – lambertj
    Commented Oct 5, 2018 at 20:11
  • If you also want to ask how to do this in QGIS, please do that in a separate question.
    – PolyGeo
    Commented Oct 5, 2018 at 20:27
  • Assuming the polygons represent parcels, is there a parcelID that you can use to join the two different parcel tables? Commented Oct 5, 2018 at 22:23

1 Answer 1

1

Spatial Join the data from 2015 to 2018 using match option HAVE_THEIR_CENTER_IN. This will join the attributes from 2015 to the attribute table of the 2018 feature class.

Then add a field and calculate using Field Calculator with some if/else statements to check for each house if the condition is better or worse. This field can be used to symbolize better/worse like in your screenshots.

If you also want to check if overall condition has improved, use Summary Statistics to Count number of better or worse.

Another way would be: Enabling time on your data. But probably not worth the effort when you only have two "times", 2015 and 2018.

Your Answer

By clicking “Post Your Answer”, you agree to our terms of service and acknowledge you have read our privacy policy.

Not the answer you're looking for? Browse other questions tagged or ask your own question.