4

Using native Python and arcpy function what method is best to create a histogram of raster dataset? I know it's possible to use raterio and GDAL functions, but I would like to keep it a arcpy and native Python.

Specifically I am working on a script to delineate watersheds and I would like to create a raster based on the values in a flow accumulation raster dataset. From the calculated raster I would then convert to vector stream layers. The ultimate goal is to be able to create separate stream order layers.

7
  • 1
    "Is it possible?" questions are of limited use here, since the answer is nearly always an unhelpful, "Yes." Please Edit the question to focus on the "How is it possible?" using your own Python code as a starting point (all coding questions are expected to contain code).
    – Vince
    Commented Nov 26, 2018 at 1:55
  • @Vince thank you. I have edited my question. At this time I do not have a code sample to provide because at this time I do not know where to start on this problem within my script.
    – Ethan Goss
    Commented Nov 26, 2018 at 2:07
  • What's wrong with standard stream order tool in hydrology toolbox?
    – FelixIP
    Commented Nov 26, 2018 at 3:47
  • @FelixIP I would like to use that tool, but it requires a stream raster. I would like to use the histogram of the flow accumulation values to determine the threshold values for the stream raster layer. If there is a better way to do this, I am all ears. This was just the way I thought I might be able to determine them.
    – Ethan Goss
    Commented Nov 26, 2018 at 4:07
  • Should be hydrological things to account for. 3ha is common for urban subcatchments. Histogram will look weird anyway, when you think of what it represents.
    – FelixIP
    Commented Nov 26, 2018 at 5:58

1 Answer 1

6

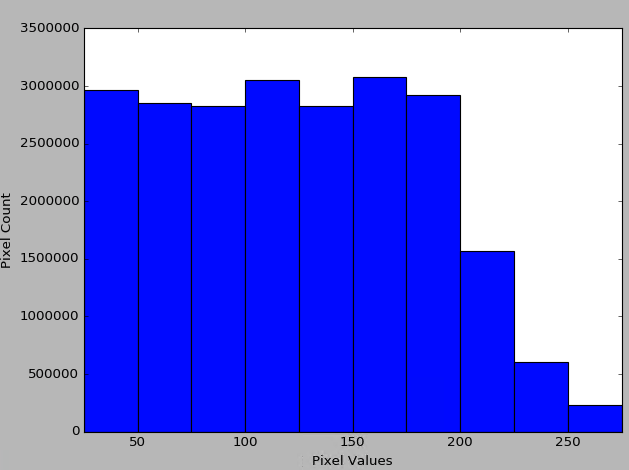
I would recommend converting your raster to a numpy array, which you can then use to calculate statistics for the histogram. matplotlib is then used for the plotting. For example:

import arcpy
import numpy as np
import matplotlib.pyplot as plt

# This example uses an 8bit unsigned format TIFF image
tiff = r'C:\path\to\your\image.tif'

# Convert raster to numpy array and calculate histogram
array = arcpy.RasterToNumPyArray(tiff)
hist, bins = np.histogram(array, bins = [25,50,75,100,125,150,175,200,225,250,275])

# Plot the histogram
plt.bar(bins[:-1], hist, width = 25)
plt.xlim(min(bins), max(bins))
plt.ylabel('Pixel Count')
plt.xlabel('Pixel Values')
plt.show() 

enter image description here


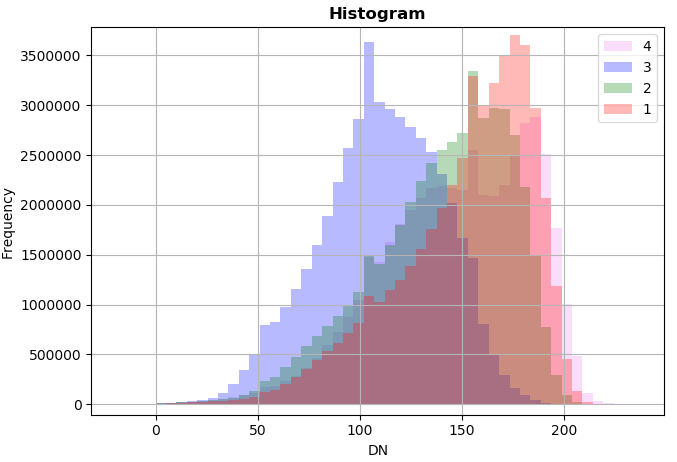
However, I believe Rasterio does a better job plotting raster histograms. For example, here is a Rasterio generated histogram of 4 band NAIP imagery:

import rasterio
from rasterio.plot import show_hist

src = rasterio.open("path/to/your/image.tif")
show_hist(
    src, bins=50, lw=0.0, stacked=False, alpha=0.3,
    histtype='stepfilled', title="Histogram")

enter image description here

4
  • Is this tool able to be run on a raster dataset or will I need to export the raster from my gdb to run it?
    – Ethan Goss
    Commented Nov 26, 2018 at 4:11
  • @EthanGoss You should be able to use a FGDB raster.
    – Aaron
    Commented Nov 26, 2018 at 4:23
  • @Aaron: +1. Is there a way to automatically choose the bin values based on the min & max values in the raster file? Thanks
    – Tung
    Commented Mar 5, 2020 at 16:21
  • @Tung Yes, you can certainly modify the bins based on min max values. However, I would recommend opening a new question for that.
    – Aaron
    Commented Mar 5, 2020 at 18:00

Not the answer you're looking for? Browse other questions tagged or ask your own question.