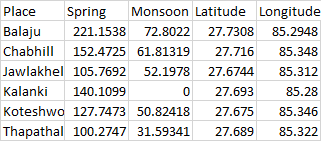
I have csv file like this:
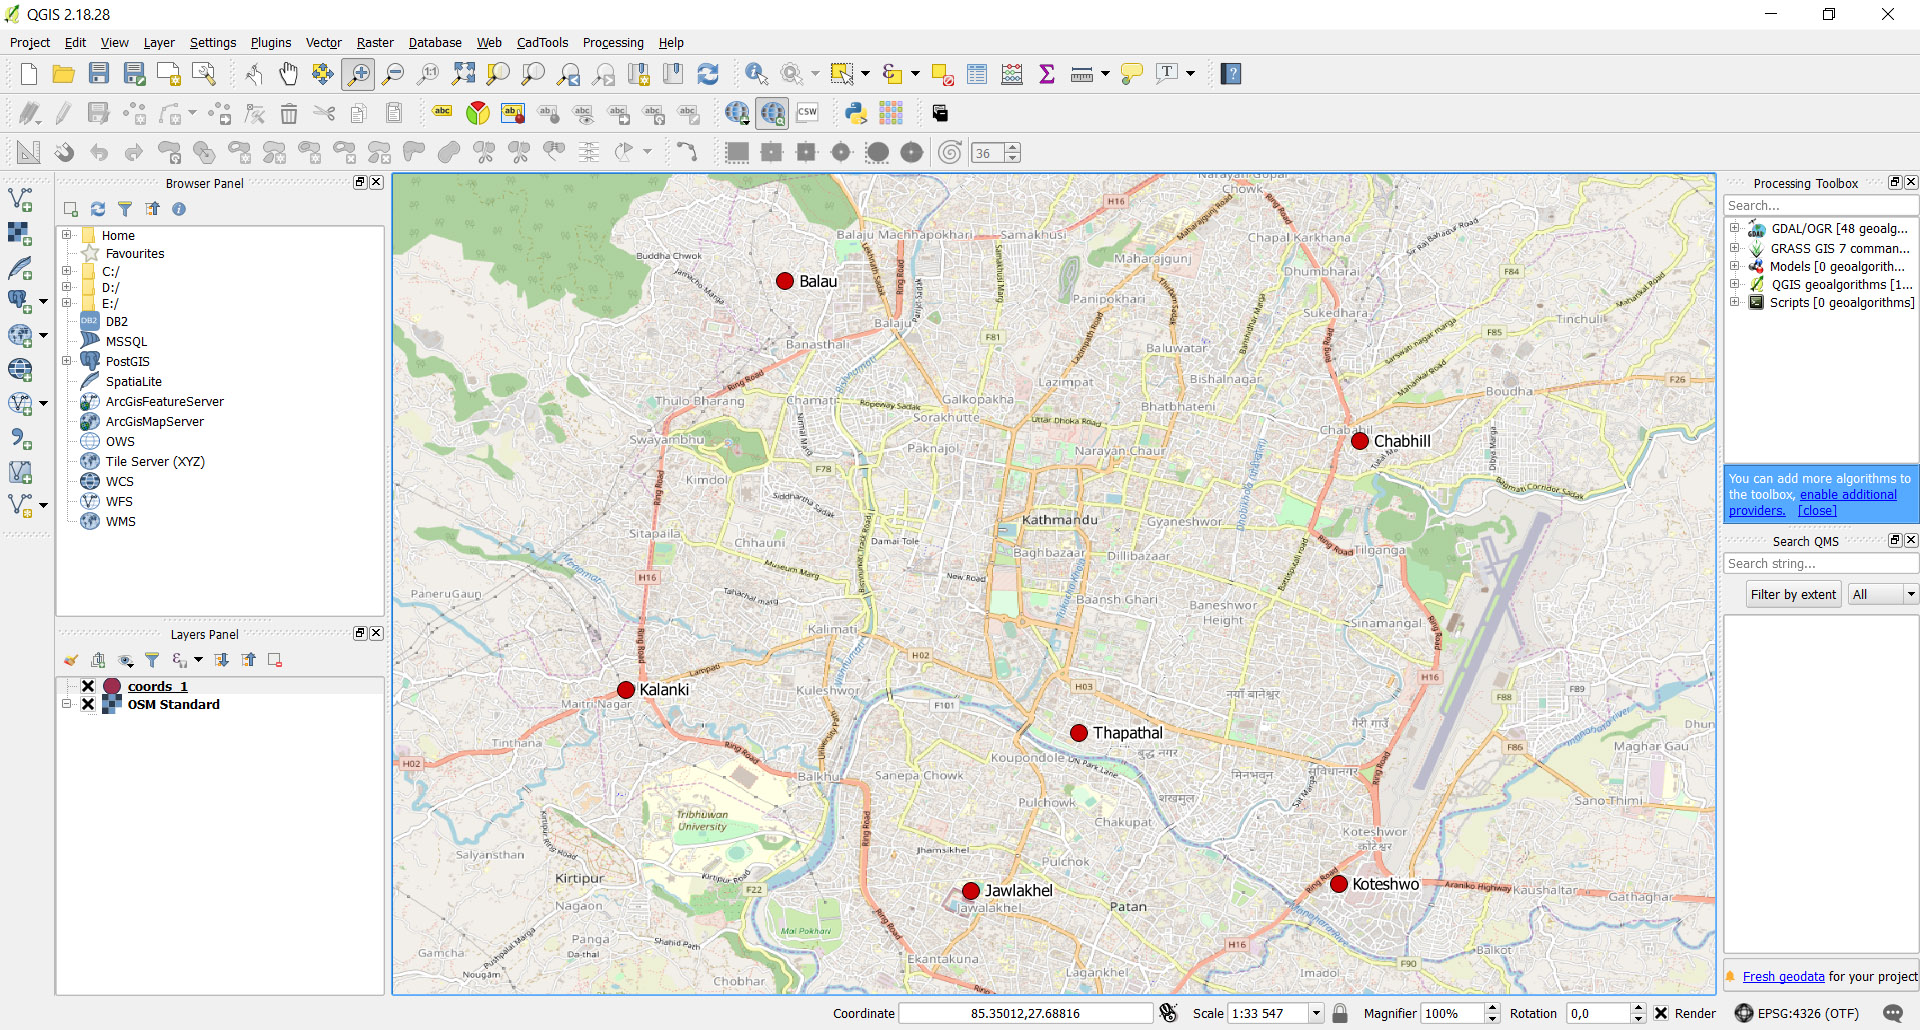
I want to plot these places in a map. I have added these coordinates with the help of google earth and tried to plot these coordinates in both QGIS and ArcMap. But, the location is showing in different place than the actual location. How can I solve it?
In QGIS,the x field is longitude and yfield is latitude and the CRS is EPSG 4326.


