2

I am trying to define a set of colours by month on a ui.Chart.image.series, however, after adding the .style line, no changes are made. I would like to have a different bar color for each month, the palette should repeats over different years.

My code so far looks like this:


var dataset = ee.ImageCollection('TRMM/3B43V7')
                  .filter(ee.Filter.date('1998-01-01', '2019-06-30'));
var precipitation = dataset.select('precipitation');
var precipitationVis = {
  palette: ['blue', 'purple', 'cyan', 'green', 'yellow', 'red'],
};
Map.setCenter(6.746, 46.529, 3);
Map.addLayer(precipitation, precipitationVis, 'Precipitation');


// Define a region of interest as a buffer around a point.
var geom = ee.Geometry.Point(-74.08384, 9.42503).buffer(500);

// Create and print the chart.
var mean_prec_chart = ui.Chart.image.series(precipitation, geom, ee.Reducer.mean(), 12);
mean_prec_chart.setChartType('ColumnChart');
mean_prec_chart.style({color:['blue','red','green','brown']});
print(mean_prec_chart);

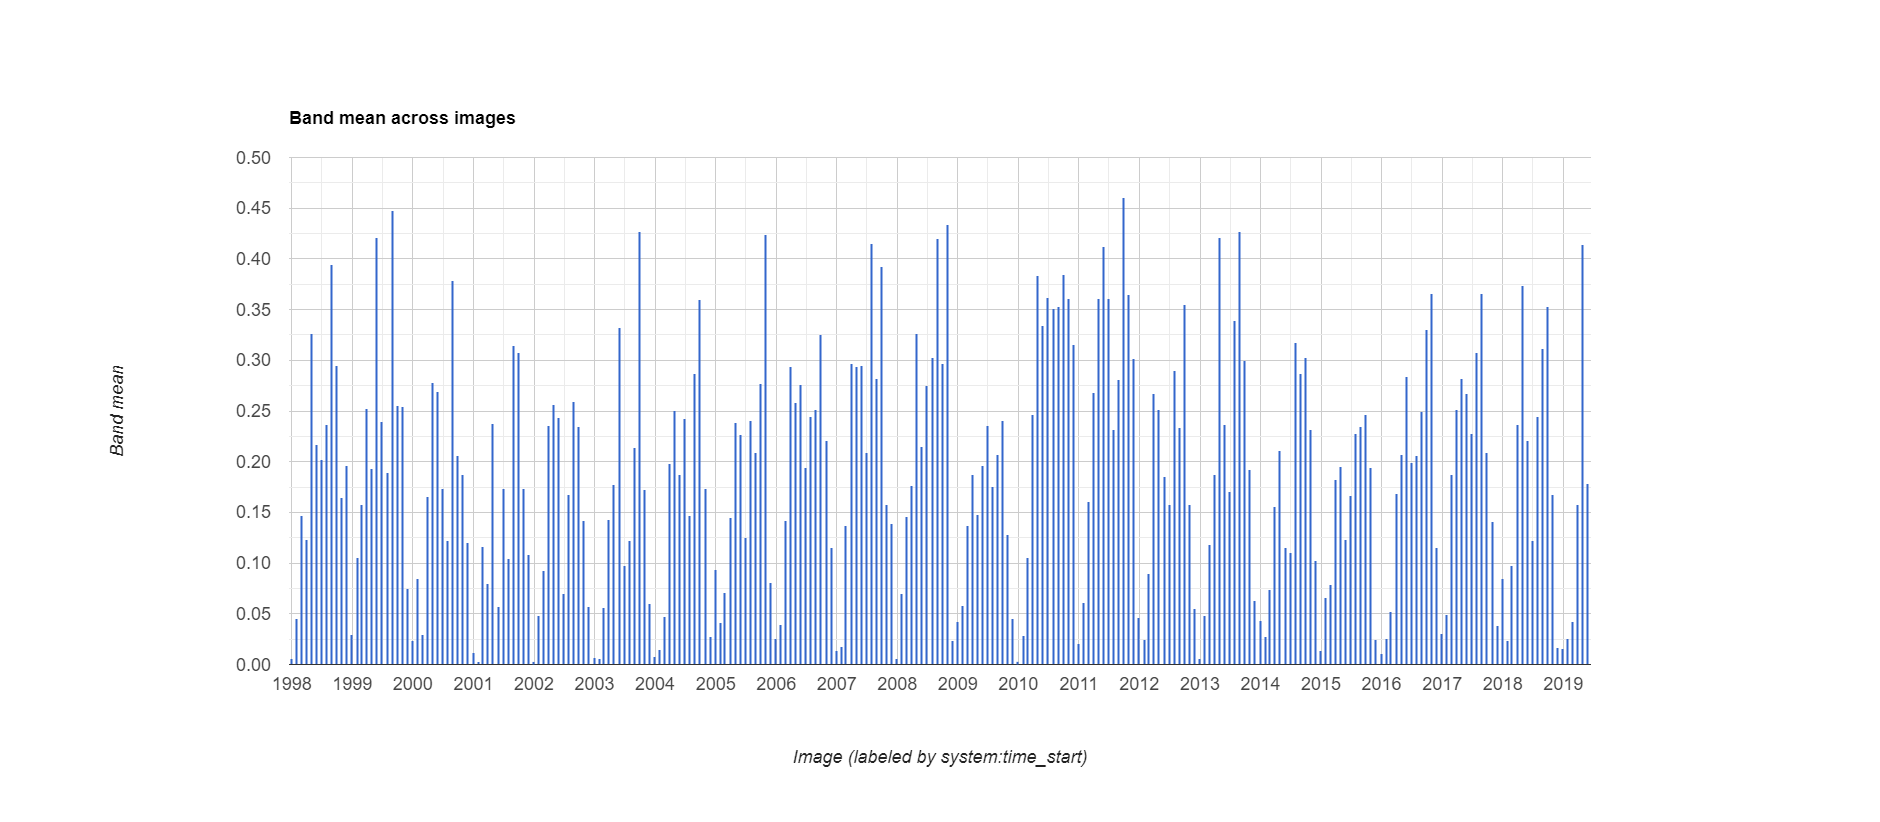
Resulting chart

2 Answers 2

3

You will need to rework the data calculated in ui.Chart.image.series() into a feature collection. Then you will add a property for each different month and you can plot each month using ui.Chart.feature.groups().

// put the data similar as presented in the chart above in a featureCollection
var featsPrecipitation = ee.FeatureCollection(precipitation.map(function(image){
  var precip = image.reduceRegion(ee.Reducer.mean(),geom, 12);
  var groupProp = image.date().format('MM');
  return ee.Feature(null, precip).copyProperties(image, image.propertyNames())
                    .set('month', groupProp);
}));
print(featsPrecipitation)

var mean_prec_chart = ui.Chart.feature.groups(featsPrecipitation, 
                                              'system:time_start', 'precipitation', 'month');
mean_prec_chart.setChartType('ColumnChart')
// by default, all months will have another colour. But you can set them by your own
// mean_prec_chart.style({color:['blue','red','green','brown']});
print(mean_prec_chart);

The chart will visually look a bit different due to the distance between the bars, but the data is similar.

link code

4
  • Thanks @Kuik, this is what I was looking for, however, I am struggling now to make the bars a bit wider.
    – OscarBau
    Commented Oct 2, 2019 at 13:41
  • I didn't succeed either. Maybe ask on the forum.
    – Kuik
    Commented Oct 3, 2019 at 7:28
  • This method does not seem to be working for me. Even the linked code doesn't seem to work. chart.style isn't changing the chart, it's just returning the 'ActiveDictionary'. See here for the relevant docs.
    – Anson Call
    Commented Jul 18, 2022 at 23:23
  • It looks like the proper way to do this in 2022 is to set the color using chart.setOptions({colors}). See here for an updated example.
    – Anson Call
    Commented Jul 18, 2022 at 23:33
0

Thanks, @Kuik, that helped a lot. I just found out how to make the bars wider:

    .setOptions({
      ....,
      isStacked: true
    });

otherwise, there is space for another bar next to it, thus making the bars narrow.

1
  • This does not provide an answer to the question. Commented Jan 1, 2021 at 17:59

Your Answer

By clicking “Post Your Answer”, you agree to our terms of service and acknowledge you have read our privacy policy.

Not the answer you're looking for? Browse other questions tagged or ask your own question.