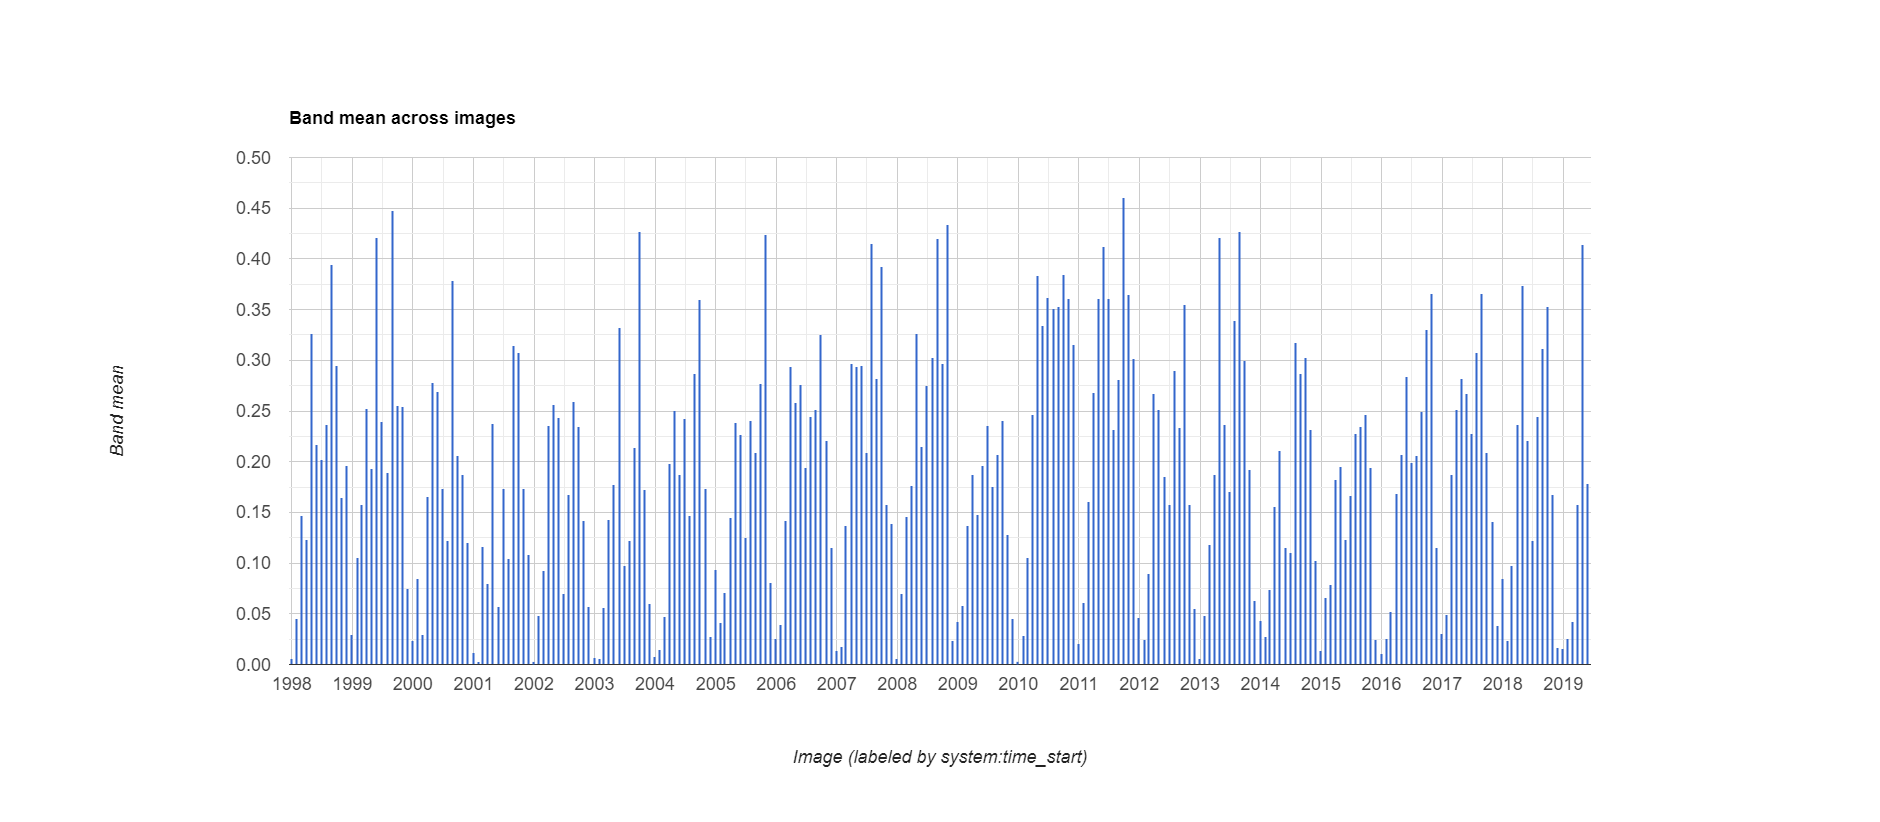
I am trying to define a set of colours by month on a ui.Chart.image.series, however, after adding the .style line, no changes are made. I would like to have a different bar color for each month, the palette should repeats over different years.
My code so far looks like this:
var dataset = ee.ImageCollection('TRMM/3B43V7')
                  .filter(ee.Filter.date('1998-01-01', '2019-06-30'));
var precipitation = dataset.select('precipitation');
var precipitationVis = {
  palette: ['blue', 'purple', 'cyan', 'green', 'yellow', 'red'],
};
Map.setCenter(6.746, 46.529, 3);
Map.addLayer(precipitation, precipitationVis, 'Precipitation');


// Define a region of interest as a buffer around a point.
var geom = ee.Geometry.Point(-74.08384, 9.42503).buffer(500);

// Create and print the chart.
var mean_prec_chart = ui.Chart.image.series(precipitation, geom, ee.Reducer.mean(), 12);
mean_prec_chart.setChartType('ColumnChart');
mean_prec_chart.style({color:['blue','red','green','brown']});
print(mean_prec_chart);

