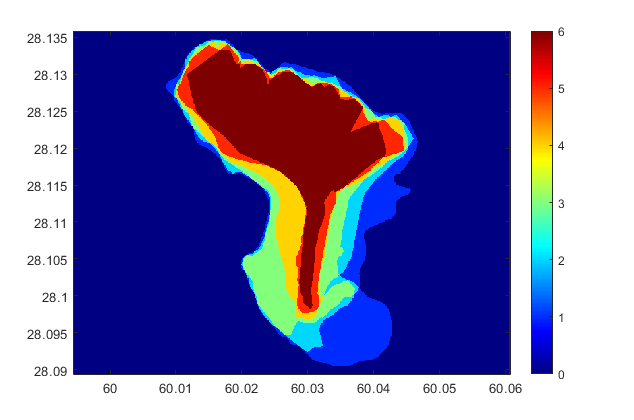
I have several polygons drawn in Google Earth, saved as .kml files. They represent the same feature (a lava flow) as identified by different people on satellite images (so one polygon = one person). My goal is to build a map as this one, where the color represents the number of overlapping polygons, here from 0 to 6:
I've done this with Matlab, by "rasterizing" (using the inpolygon function and a meshgrid). The problem is that I lose the vector information. For instance, I can't calculate the area of the polygon where the 6 flows overlap (I can sum all the pixels with the same value, but this is imprecise because of the pixel size). Plus I get some distortion due to the shift in coordinate system.
I figured I'd better do it with QGIS but this is where I get stuck. I managed to load the polygons, and that's pretty much it... I think I should use a geoprocessing tool like intersect but it takes only two layers as input. Is there any way to do this?

