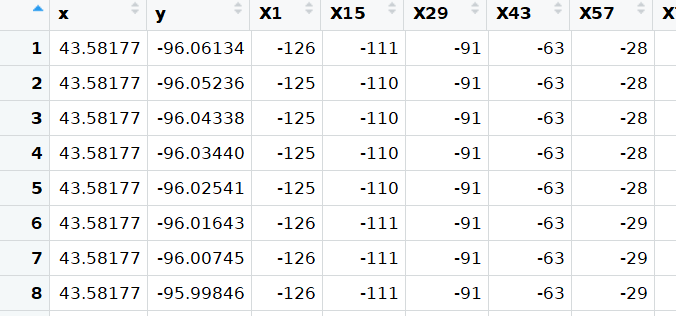
I have a CSV of biweekly temperature values for the year 2011, at a 1000-m scale in part of the state of Iowa. The CSV contains ~95000 rows of temperature data, with the first 2 columns as the x and y points and the subsequent 27 columns are the 14-day intervals. I am trying to convert the CSV into a raster stack at 30-m resolution using interpolation, where each layer of the stack is a biweekly period (27 layers). The code I am using to convert from a CSV to raster stack also uses a reference raster, which is a raster layer of the correct extent and 30-m resolution.
This code has worked for me before for smaller CSV files.
pts <- read.csv("bimonthly_1000m_temp.csv")

ref = raster("~/reference_raster.tif")
u=crs(ref)

coordinates(pts)=~y+x
proj4string(pts)=CRS("+init=epsg:4326") # set it to lat-long
pts = spTransform(pts,crs(u))
gridded(pts) = TRUE
r = stack(pts)
projection(r) = crs(u)
r_crop <- crop(r,ref)
extent(r_crop)=extent(ref)
r_crop_resam = resample(r_crop, ref, method='bilinear', filename = "~/interpolated_raster.tif")
But, I get an error at gridded(pts) = TRUE:
suggested tolerance minimum: 0.111429
Error in points2grid(points, tolerance, round) :
  dimension 1 : coordinate intervals are not constant
Any suggestions? This answer here is in the vein of what I am looking for, though I am trying to interpolate and creating a raster stack.


crs(u)? TryrasterFromXYZ(pts)directly after read.csv (before and instead ofusing the sp coordinates/gridded stuff)