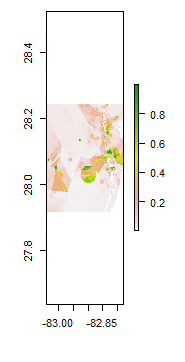
I am currently trying to create a multi-panel plot to display six raster images (3,2) using par() and plot(raster()). When I plot the rasters though, R is displaying the Y bounds far beyond what is necessary, resulting in lots of wasted space. How can I adjust this? When, I run extent() on the raster images themselves, the extent is correct.
a<-raster("file.tif")
...and so on to f.

par(mfrow=c(2,3))
plot(a)
plot(b)
plot(c)
plot(d)
plot(e)
plot(f)

