2

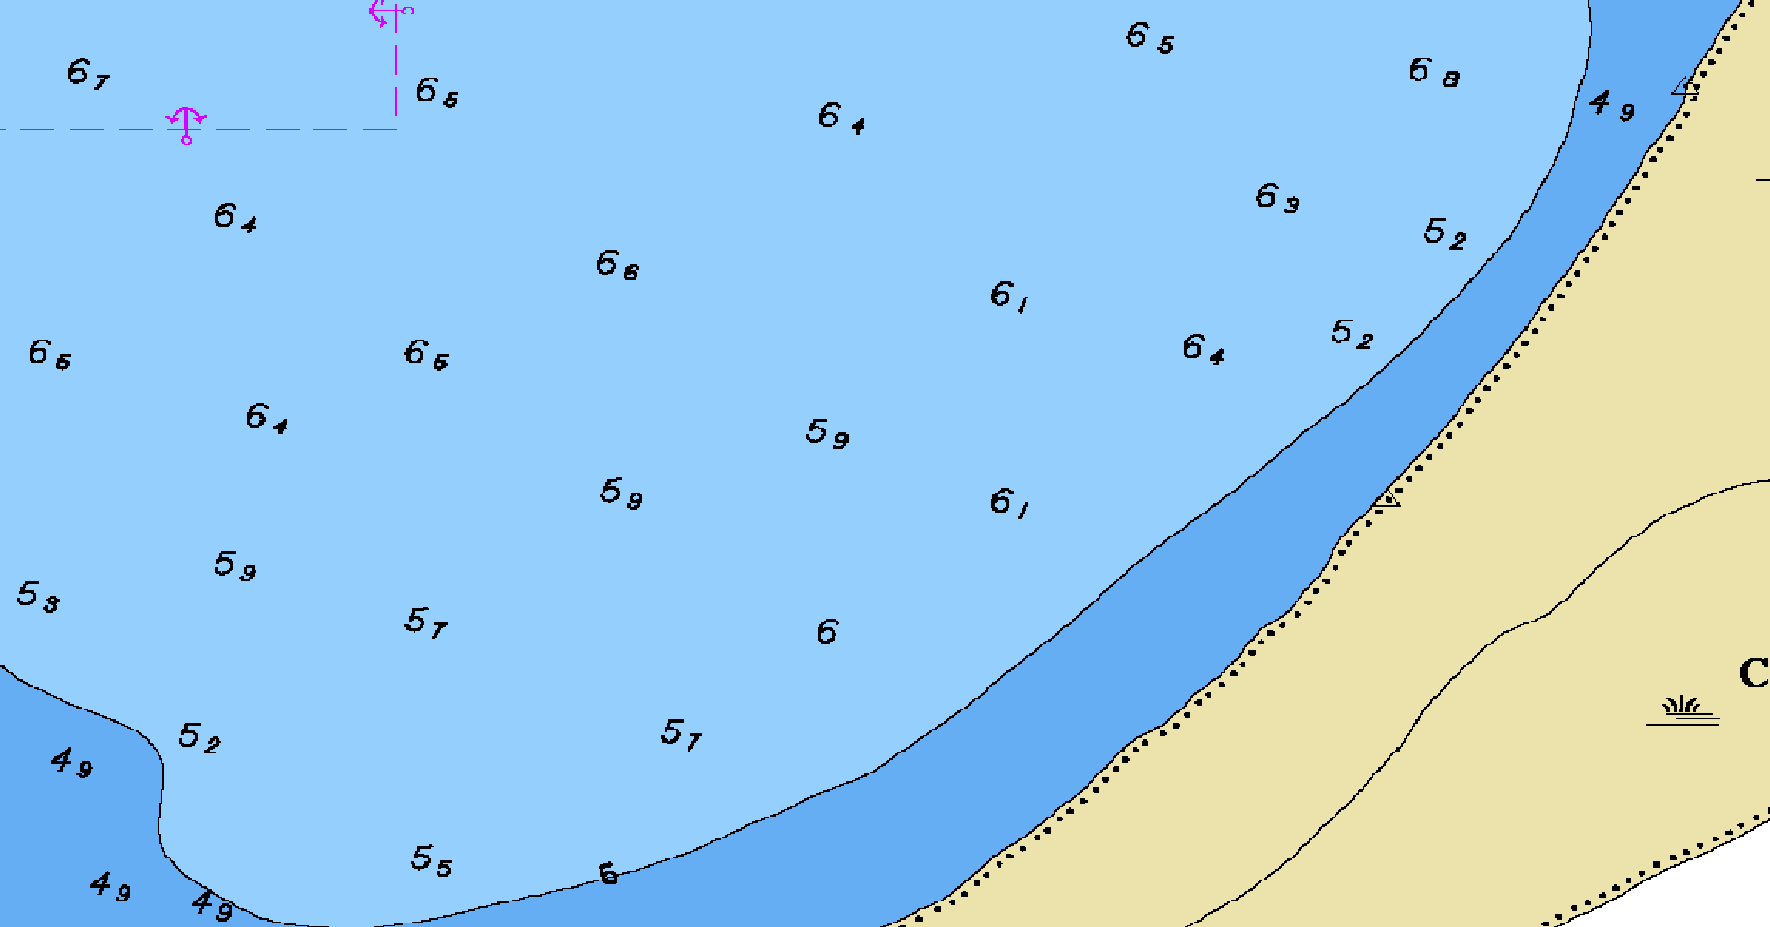
I want to build a digital terrain model from nautical charts. I need to capture the points where depth is indicated in the chart, and for each point, I must attribute the depth value. One by one, to be sure I capture all points and give the right value. And left a marker on the points to indicate which was already digitized. Below an example of a nautical chart. Blue is water, light brown is land, numbers are depth.

enter image description here

I found tools to digitize points, lines and plots. But didn't find how to attribute values manually to the digitized points.

1
  • Thank you for the answers! They help me to advance... and also this video youtube.com/watch?v=m12ZXpGBoDc. I created a GeoPackage Layer and can get points, type the depth, and left a mark. However, when I open the Attribute Table, I see only 'fid' and the field I created. How can I get the coordinates too in the Attribute Table? so I could export the CSV with the X, Y and Z values? Commented Nov 27, 2020 at 15:33

3 Answers 3

2

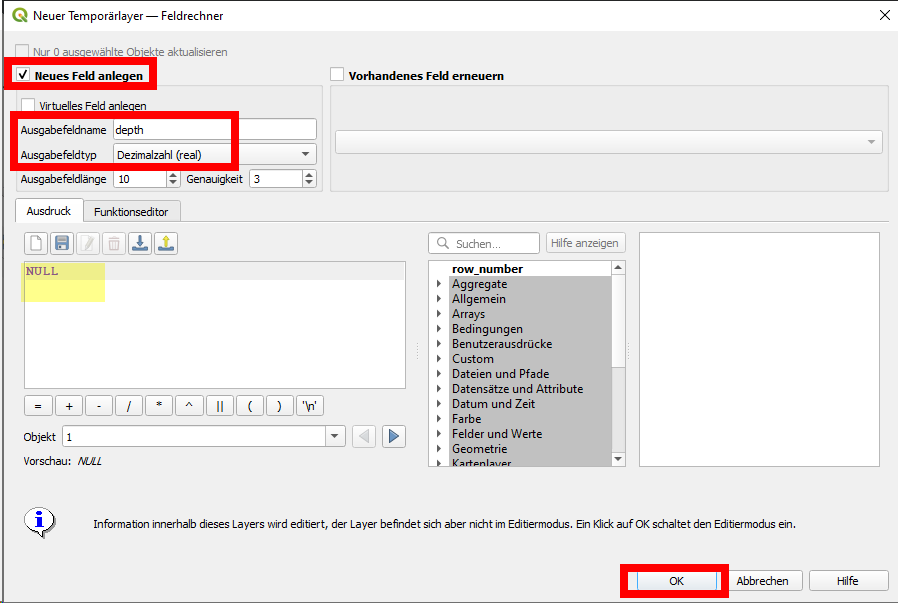
So you created a points layer and already set a few points, right? As I guess from your question, you have not yet defined any attribute fields. So you should add a field for the values you want to enter (depth). Right click your layer > open attribute table field calculator: enter image description here. In the opening dialogue, set a name for the field, field data type (like integer or real). You have to give a default input to create the field. You could just type NULL or introduce a value that appears often. Click OK. Now, your field is created. You can now fill in the values for each item (be sure to be in edit mode).

enter image description here

4
  • Thanks! I got it... easier than I thought. But how can I add the longitude and latitude fields? Commented Nov 29, 2020 at 9:56
  • $x and $y in the field calculator expression (where there is NULL in my screenshot). Be sure that your layer is in CRS EPSG:4326 to get lat and lon
    – Babel
    Commented Nov 29, 2020 at 10:17
  • If your layer us not in 4326, use the epression from here: gis.stackexchange.com/questions/367854/…
    – Babel
    Commented Nov 29, 2020 at 10:19
  • If unsure, use the expression from the site referenced in the last comment
    – Babel
    Commented Nov 29, 2020 at 10:23
1

In case you haven't got your vector file yet:

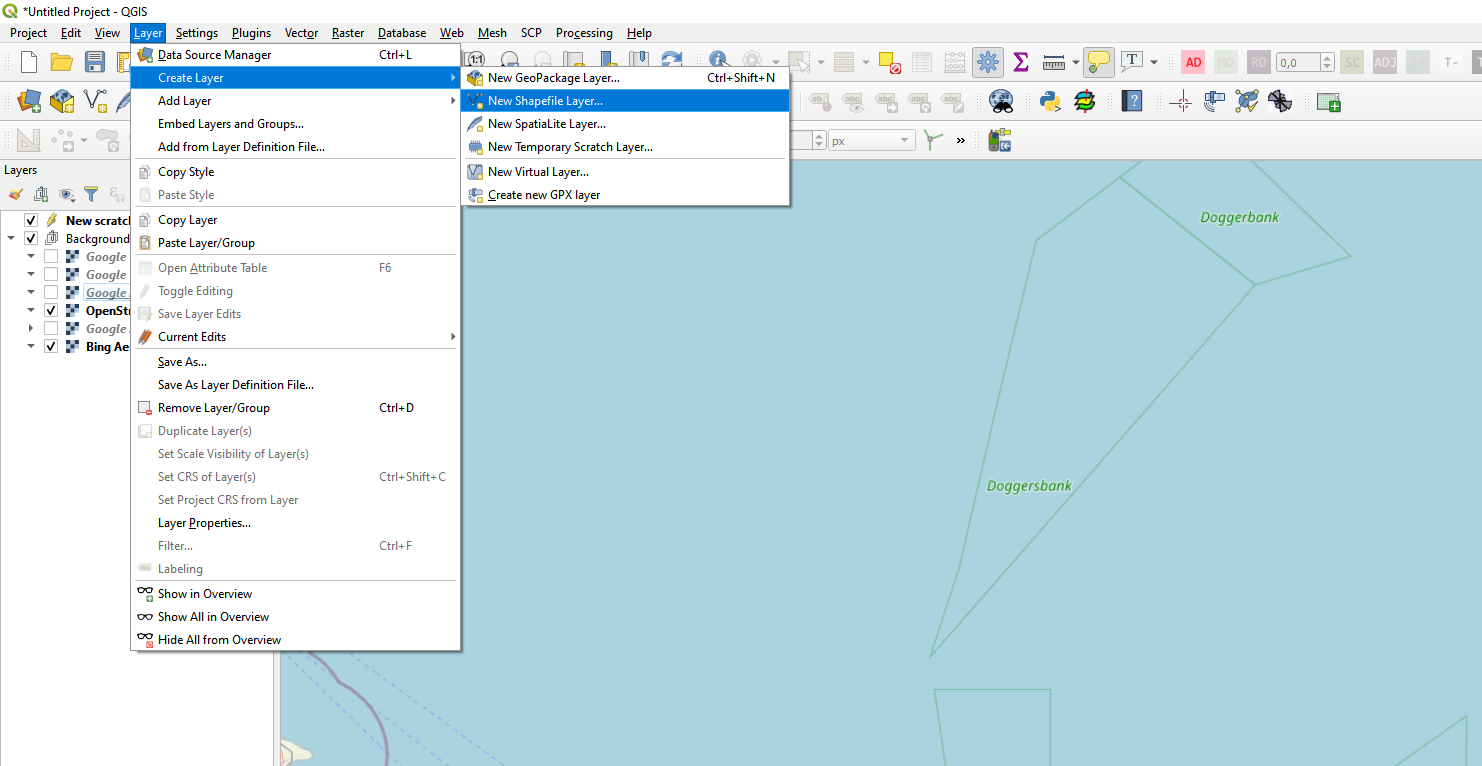
First create a new layer. You want a vector file, shapefiles are most commonly used. Vector creation

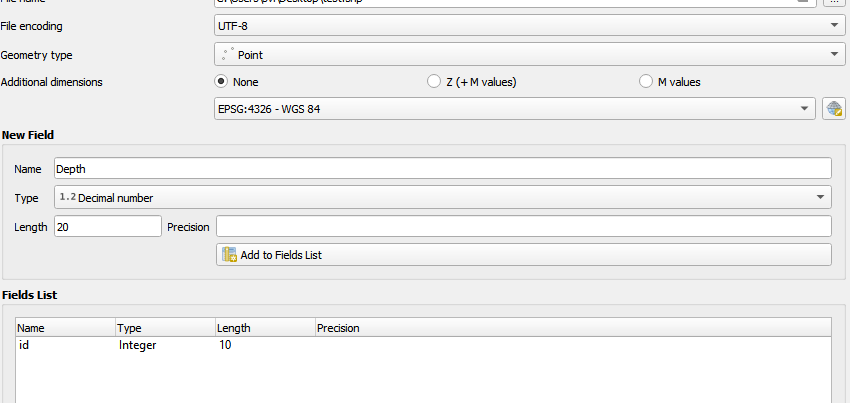
Make sure to select Points for Geometry type and fill in Depth or something similar as name for the new field. As Type chose 'Decimal number'. Click on add to Field List and save.

Depth as decimal number

In case you already have a shapefile or other vector file:

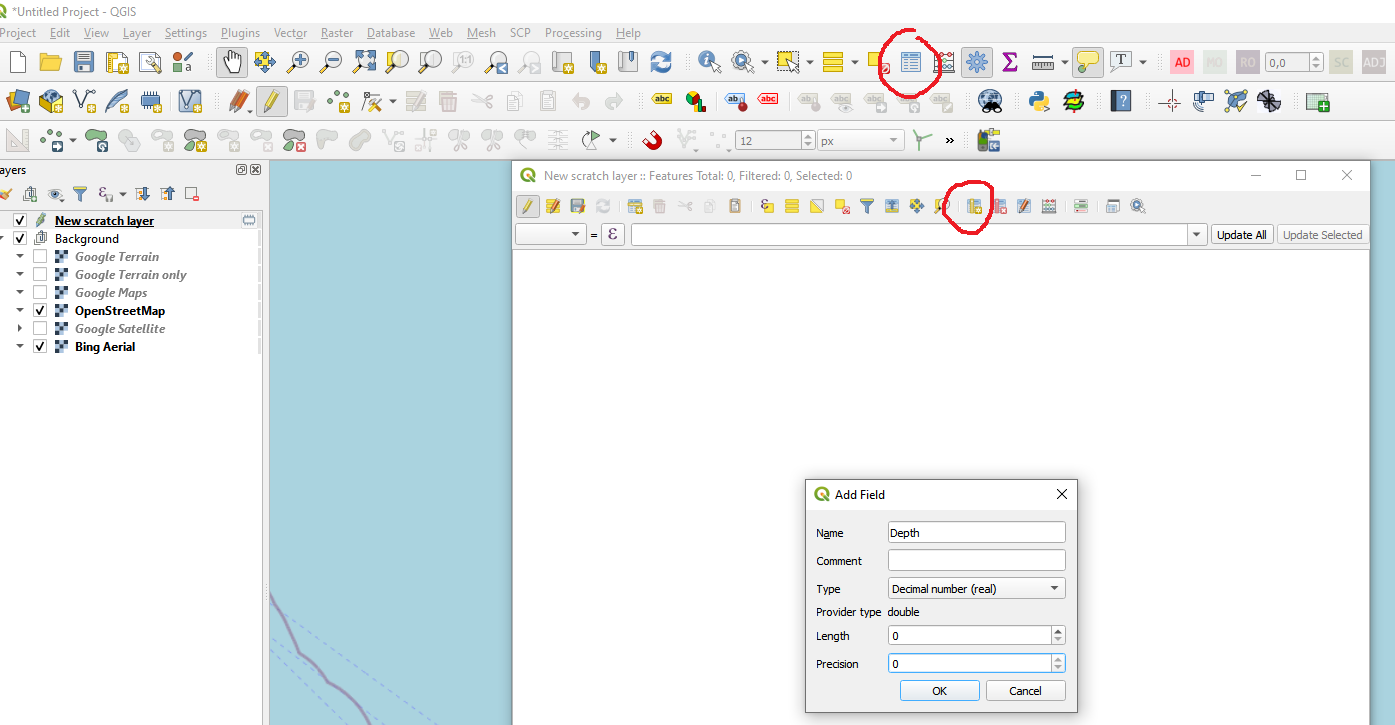
  1. Open attribute table (F6) and make sure the layer is editable (pencil).
  2. New Field (ctrl+w).
  3. Fill in Depth or something similar as name for the new field.
  4. As Type chose 'Decimal number'.

Add Field

Now when you digitise a new point, it will ask for a depth and you can fill it in manually.

1
  • Thanks. Easier than I thought! But how can I include the latitude and longitude fields? Commented Nov 29, 2020 at 9:58
0

I got it!

But, maybe I found a bug.

Part 1 - The (expected) right way...

a) with a layer, create a new shapefile layer
b) using the Field Calculator, create a new field... get some points
c) export the shapefile as CSV with geometry AS_XY
d) done!

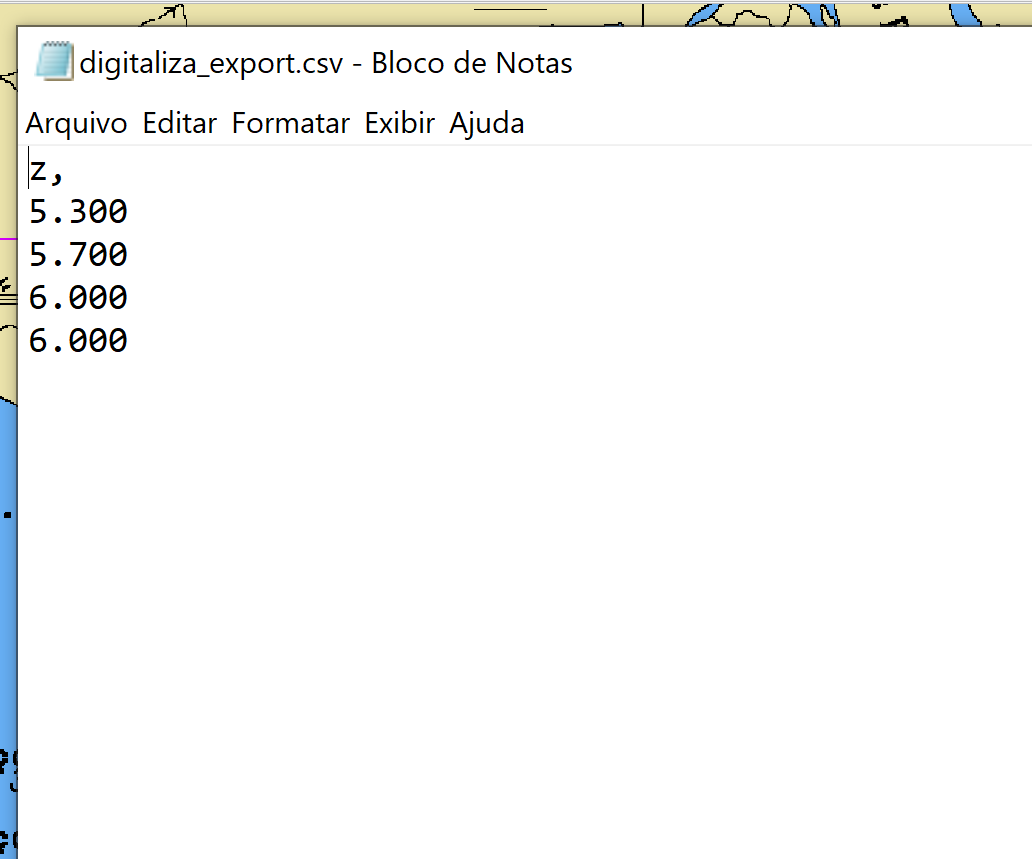
But this is not working! When I do this, I got only the fields but not the coordinates.

For a test, here is the Attribute table enter image description here
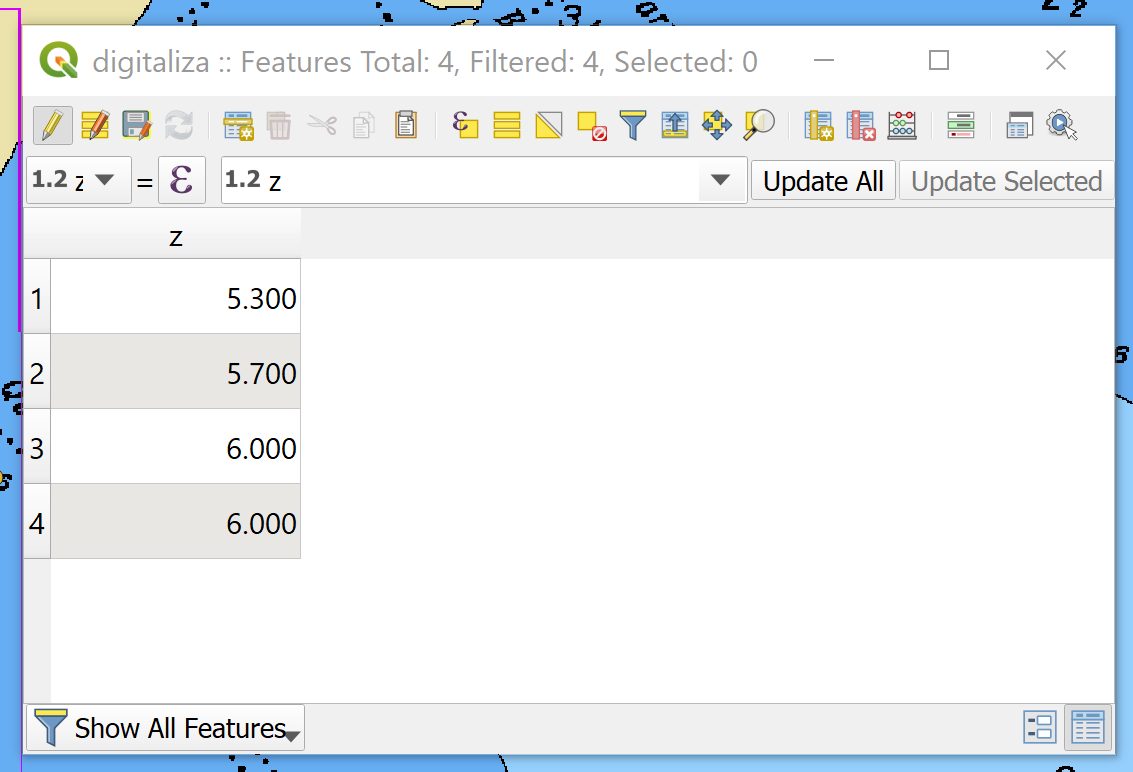
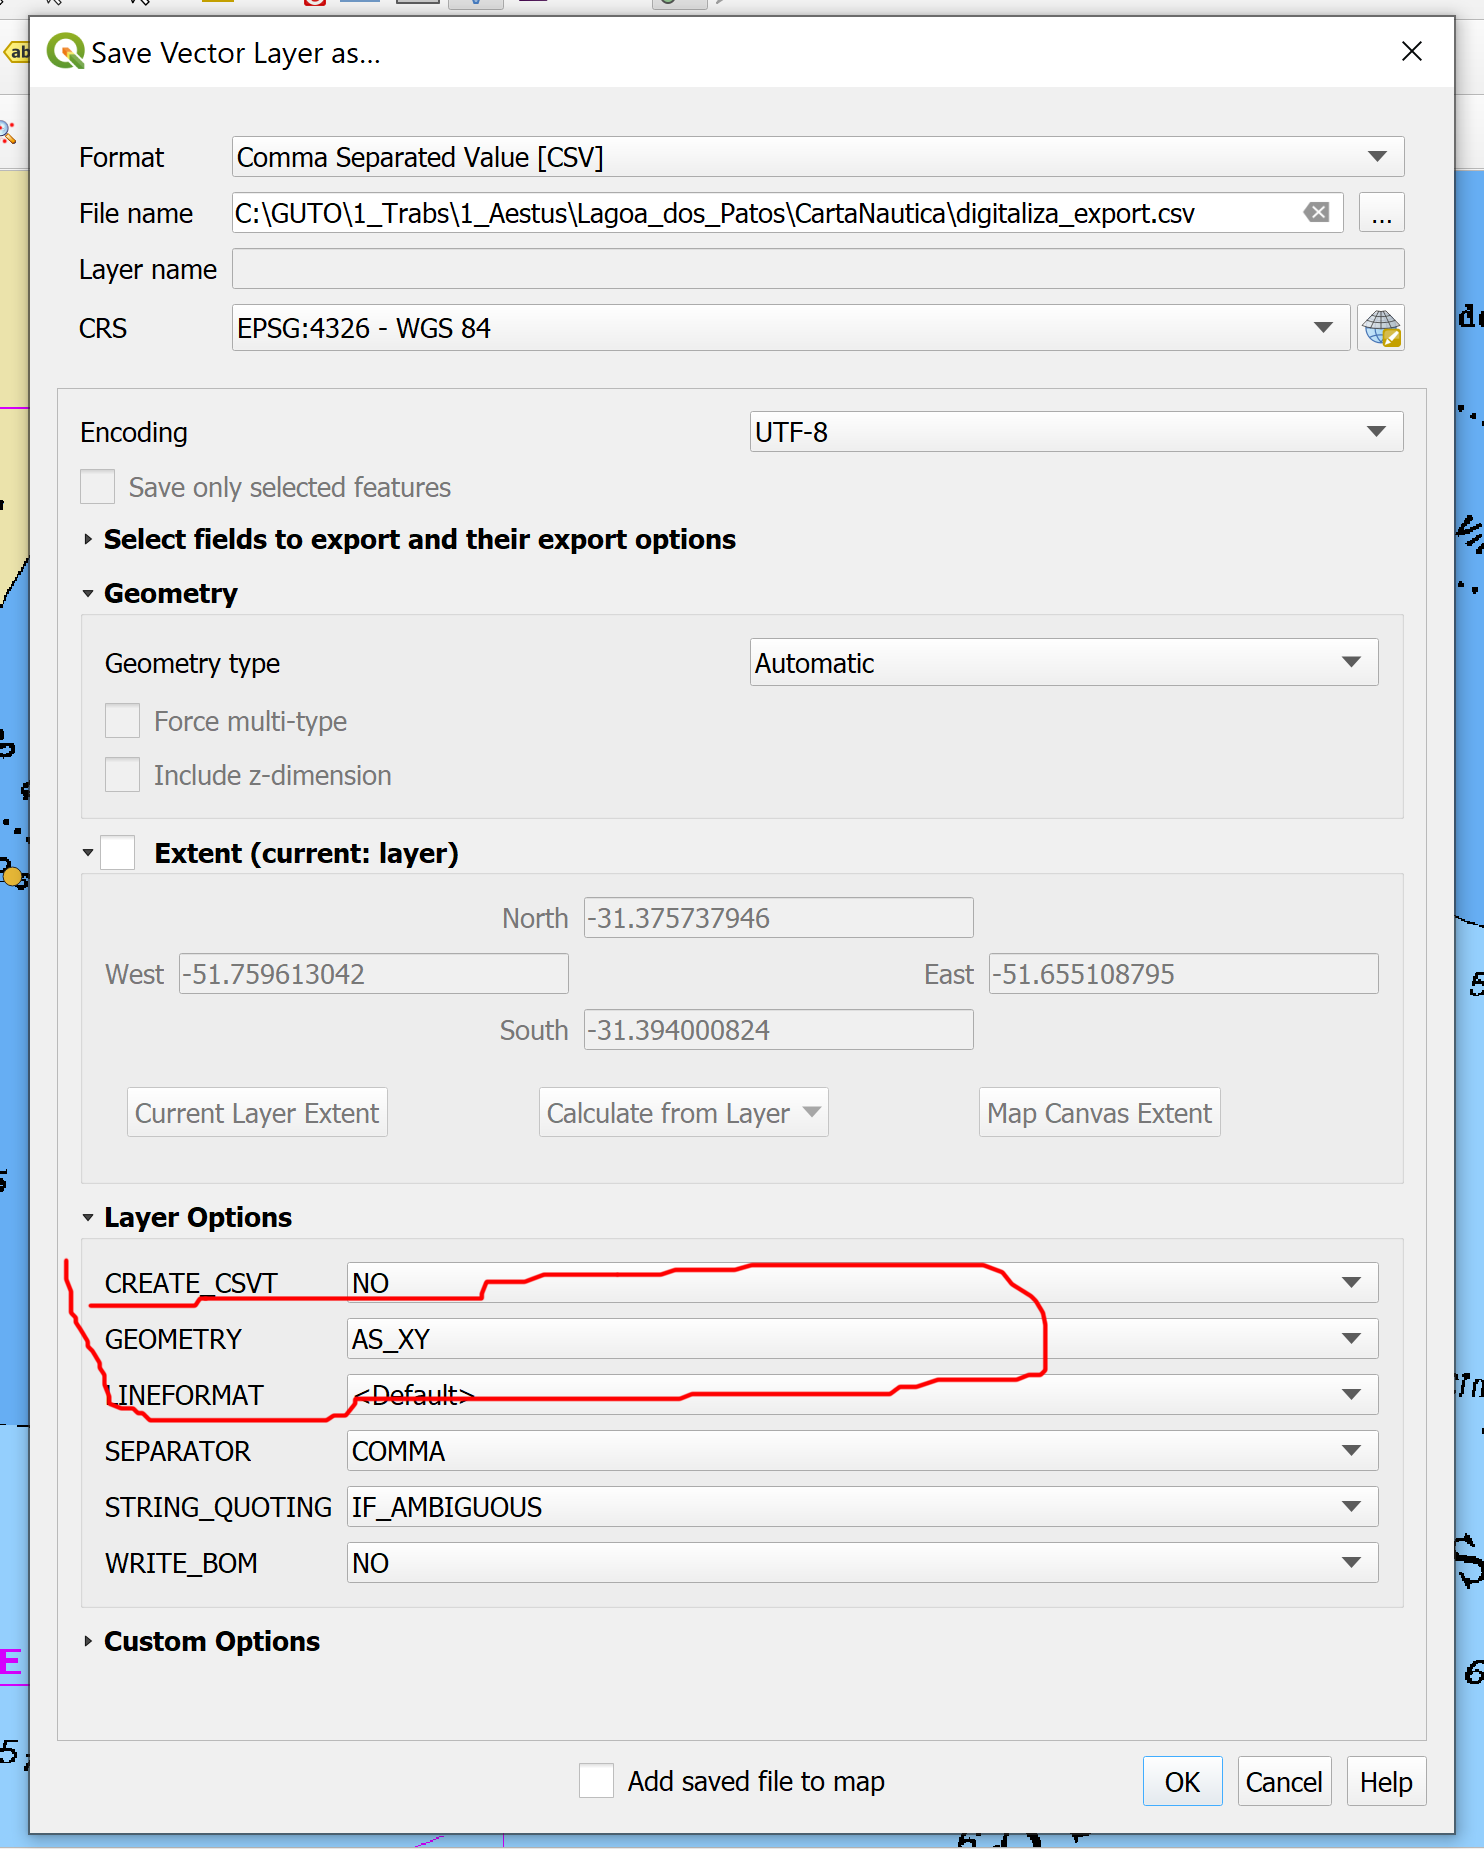
Here is how I'm exporting it enter image description here

This is what I got enter image description here

But... when I created the longitude and latitude fields (described below), this is the attributed table enter image description here
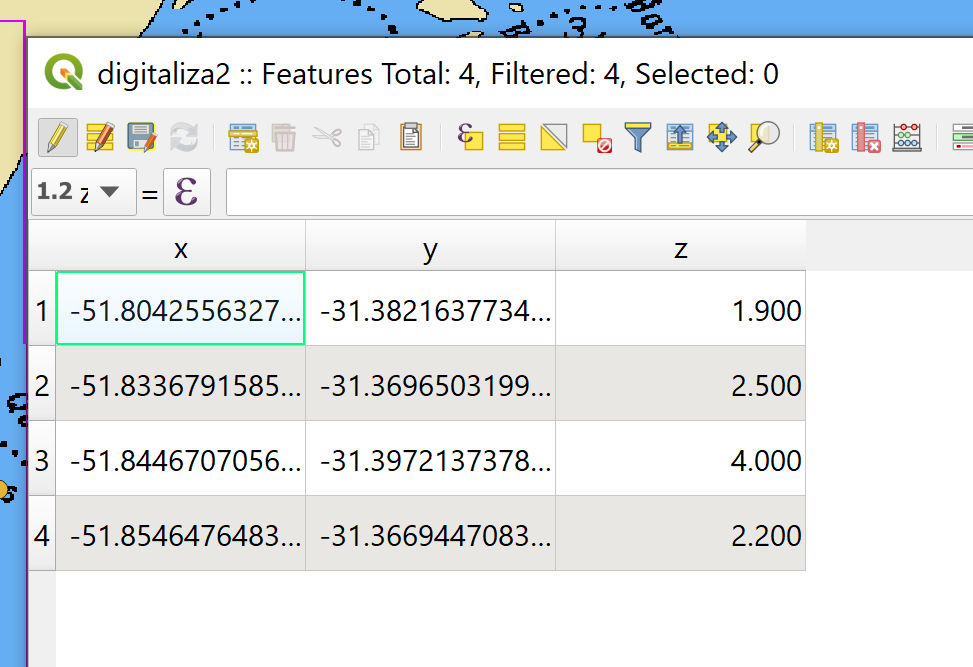
And exporting it exactly the same way above, I got this enter image description here
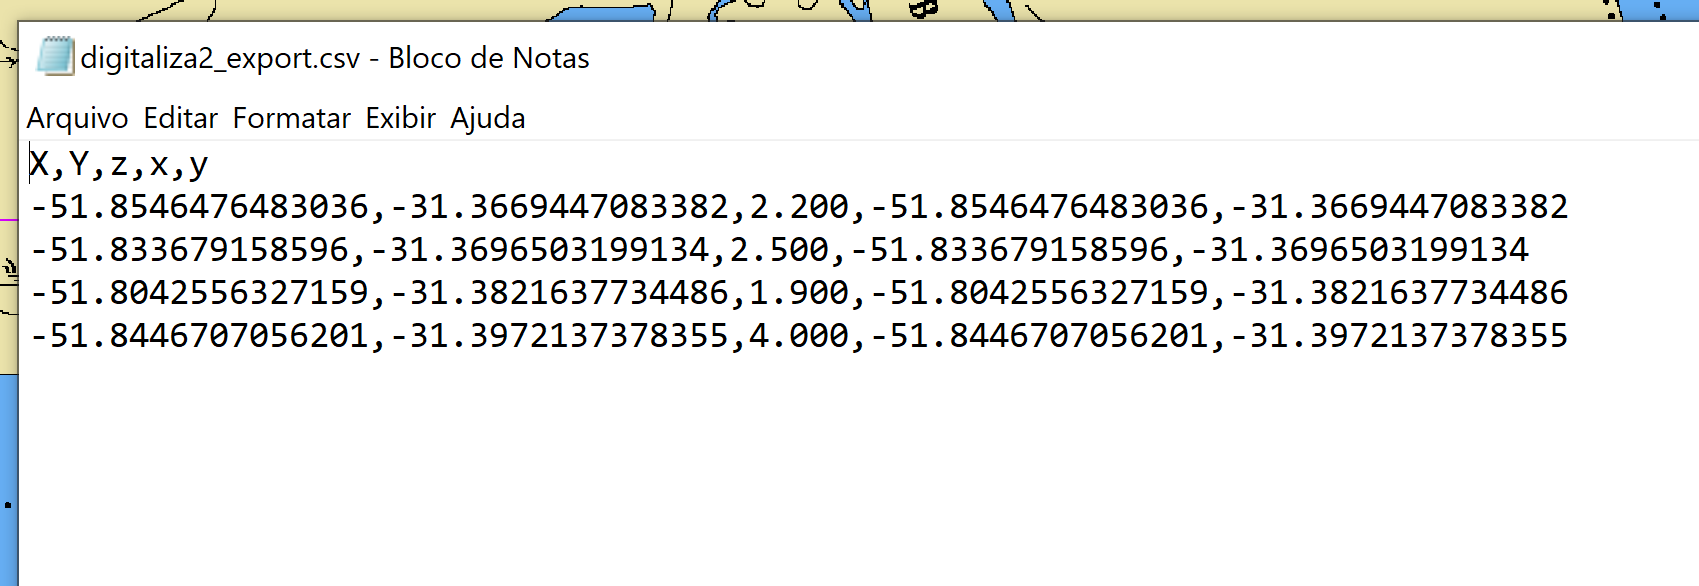
I thought that was too stupid I couldn't get the coordinates just exporting the CSV and asking for the geometry. But it was not working... It only works after a create the fields!

Part 2 - The turnaround

After assessing the problem and consulting youtube, forum, etc... I finally got what I need, that is to visualize the longitude, latitude, and depth in the Attribute table. Sort of useless thing... but!

So, here an explanation for those who are not QGIS frequent users like myself.

(you already have your nautical chart layer...)

1 - create a new shapefile layer (multipoint!)
2 - using the Field Calculator tool (the abacus!), create the fields as described above... but before you set the 'depth' field, that I need to type manually after getting the points,
3 - "Create a new field" AND MARK THE OPTION "Create virtual field"
4 - Name it (as it going to be Longitude, just 'x'...)
5 - Change output field type to 'decimal number'
6 - Here is the trick! In the 'expression' aba, the middle column is a list of things (I don't know how they call them... packages?). Click in the black arrow to expand and will appear a list of 'functions'(?). Scroll down until you find '$x'. Double click on it and it will be inserted in the left box. Click 'OK'. This will deliver the longitude... 7 - Repeat the process to create a second field for latitude...
8 - Create the field 'depth' or whatever you want to prescribe during the point captures, using 'NULL' in the left box.

9 - (bonus) To change the order of fields in the table (Changing column order in QGIS?)

10 - (bonus) If you don't see the table like below, don't panic! At the bottom/right of the Attribute Table there are two buttons that switch between 'table' and 'item list'
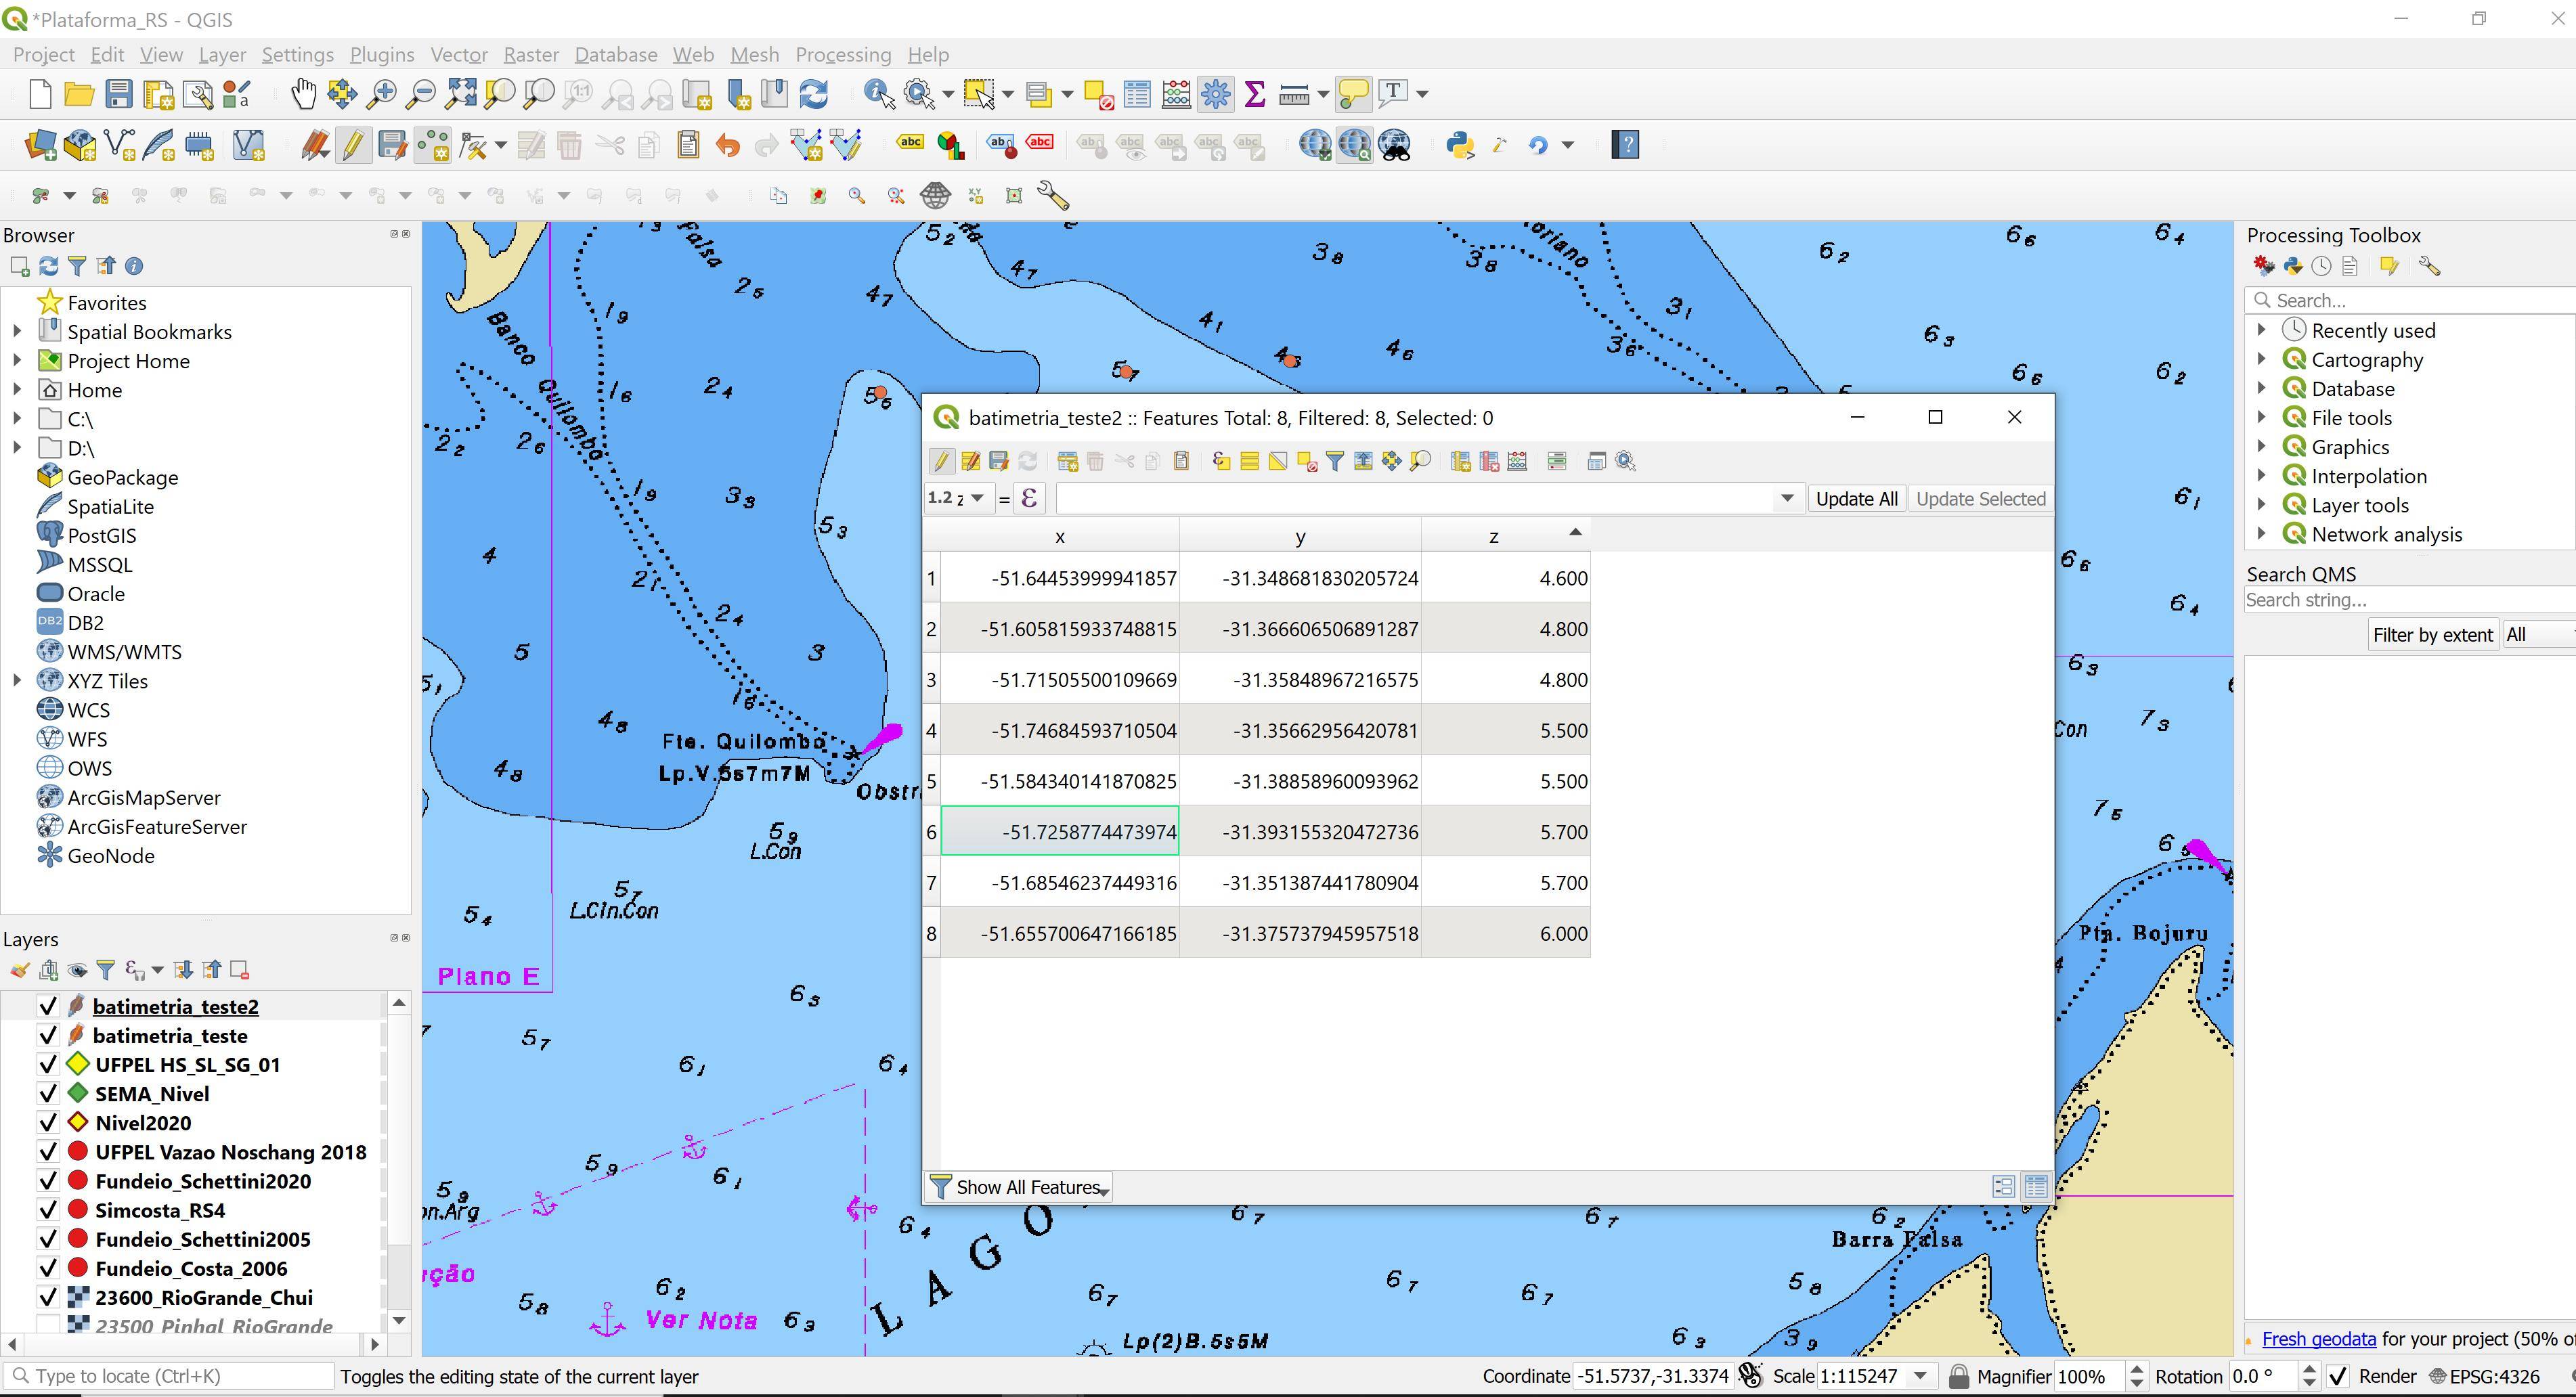
enter image description here

Your Answer

By clicking “Post Your Answer”, you agree to our terms of service and acknowledge you have read our privacy policy.

Not the answer you're looking for? Browse other questions tagged or ask your own question.