2

I adapted the script from the guide for ui.Chart.image.series to my region of interest and time period:

// Import the example feature collection and subset the forest feature.
var bm = ee.FeatureCollection("users/fulano_letal/ROI_BM_Mayor100ha_Veg1aria");

// Load MODIS vegetation indices data and subset a time period of images.
var vegIndices = ee.ImageCollection('MODIS/006/MOD13Q1')
                     .filter(ee.Filter.date('2000-01-01', '2017-12-31'))
                     .select(['NDVI', 'EVI']);

// Define the chart and print it to the console.
var chart =
    ui.Chart.image
        .series({
          imageCollection: vegIndices,
          region: bm,
          reducer: ee.Reducer.mean(),
          scale: 50000,
          xProperty: 'system:time_start'
        })
        .setSeriesNames(['EVI', 'NDVI'])
        .setOptions({
          title: 'Average Vegetation Index Value by Date for BM',
          hAxis: {title: 'Date', titleTextStyle: {italic: false, bold: true}},
          vAxis: {
            title: 'Vegetation index (x1e4)',
            titleTextStyle: {italic: false, bold: true}
          },
          lineWidth: 5,
          colors: ['e37d05', '1d6b99'],
          curveType: 'function'
        });
print(chart);

And my question is about the "scale" setting in the ui.Chart.image part, I don't understand what it does and therefore I don't know which value I should use.

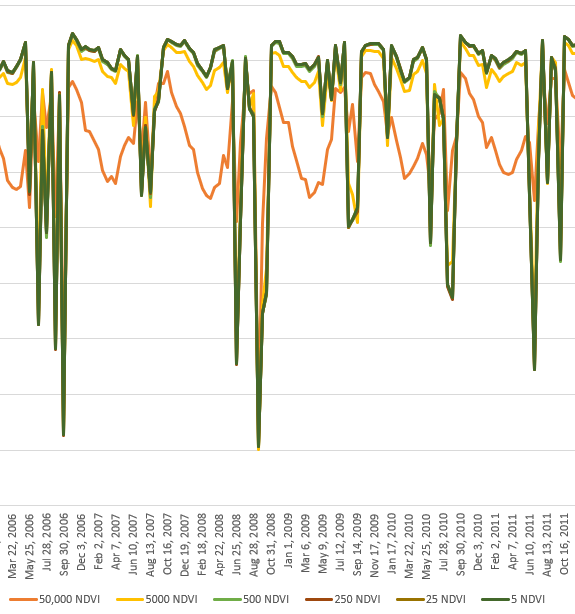
I ran a series of comparisons varying the scale with different values (5, 25, 250, 500, 5000, 50000) but still don't understand.

So, can you advise me the "scale" value I should use?

Comparison of different scales

1 Answer 1

2

The scale setting in any function of EarthEngine sets the size of the pixel to use.

In your example, you chart the mean of the NDVI value of your geometry. If you set the scale to 50000 (in meters) your pixel size is 50km X 50km. So the calculation of your chart would be very quick.

Depending on your geometry, if you set a scale to 5 (in meters) it would mean that your chart will be using 100000000 more pixels to do the calculation (which could take some time and possibly reach a limit of the your calculation, and give you an error.

Looking back at your chart, if your geometry is a farm field of 20 hectares (2km X 2km) your earlier pixel of 50km X 50 km would include a lot of extra info that isn't part of your field.

Same example, with a pixel of 5m X 5m, you would only include info that you need. (any pixels outside your geometry would be ignored).

The MOD13Q1 you are using has a pixel size of 250m. The "best" you can do is 250m. Any scale smaller than that, would just add noise, and cost time. So I would suggest you use a pixel size of 250 (in meters).

I hope this clarification is useful.

3
  • Thank you for your explanation, now it is clear to me that this setting should be accord with the resolution of the product that I want to measure. Commented Apr 11, 2021 at 22:09
  • Just to clarify, the MOD13Q1 has a pixel size of 250m so, following your advice, I will use that number in Scale. Thank's again! Commented Apr 11, 2021 at 22:19
  • I misread the documentation... I have edited my answer to reflect the correct pixel size. Thanks. Commented Apr 11, 2021 at 22:57

Your Answer

By clicking “Post Your Answer”, you agree to our terms of service and acknowledge you have read our privacy policy.

Not the answer you're looking for? Browse other questions tagged or ask your own question.