3

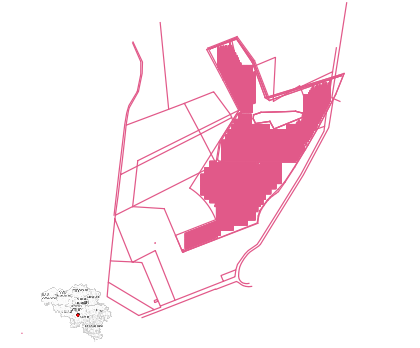
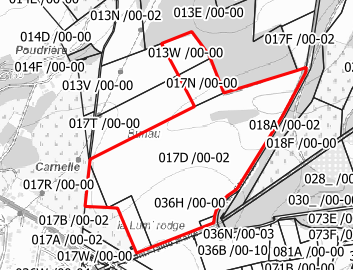
I work in QGIS 3.16 and my issue is that I have a line shapefile, which represents a park for solar panels, that is in a bigger scale and I would like to reduce it so that it fits inside an area which matches with the cadastral parcels.

enter image description here

That's the area where the solar panels should go

enter image description here

That is the location of the solar park which is much bigger.

I've managed to move the solar panels with the editing tools but I would like to know how to put it at the same size or scale of the cadastral parcels. So basically my question is how to reduce the shapefile that represents the solar panels.

3
  • 1
    Let me guess, someone drew this in CAD and didn't use proper easting & northing?
    – Erik
    Commented Dec 15, 2021 at 10:15
  • Indeed, they used CAD and I guess they didn't use proper easting or northing. Looks like it's a problem of gereferencing. Is there any solution then?
    – DobleG_95
    Commented Dec 15, 2021 at 10:26
  • Get back to whoever drew this and let them scale & place this in a fitting UTM zone. Maybe provide the parcel borders to them, so they know where to place the drawing.
    – Erik
    Commented Dec 15, 2021 at 14:39

1 Answer 1

1

Do you know the coordinate reference systems of the two files? If both maps are to scale rather than just sketched then you should be able to use the Georeferencer to get a pretty good fit.

There's quite a lot of decent material on how to use it online e.g.

https://www.youtube.com/watch?v=OS6jm81rr5s

You've got some quite clear corner points so should get a reasonable fit but you will benefit from knowing the coordinate reference system used for each.

2
  • Thank you. Both are the same CRS but I don't know how can I georeference it, since it is not a raster file but vector
    – DobleG_95
    Commented Dec 16, 2021 at 8:52
  • 1
    I don't know how much data is attached to each of your vector objects in the attribute table, but, there is always the possibility (although not ideal) of rasterizing the data and then re-vectorizing it once the georeferencing has been done. I would only suggest this if you are purely wanting this for a visualisation.
    – DMAD Tim
    Commented Dec 17, 2021 at 16:25

Your Answer

By clicking “Post Your Answer”, you agree to our terms of service and acknowledge you have read our privacy policy.

Not the answer you're looking for? Browse other questions tagged or ask your own question.