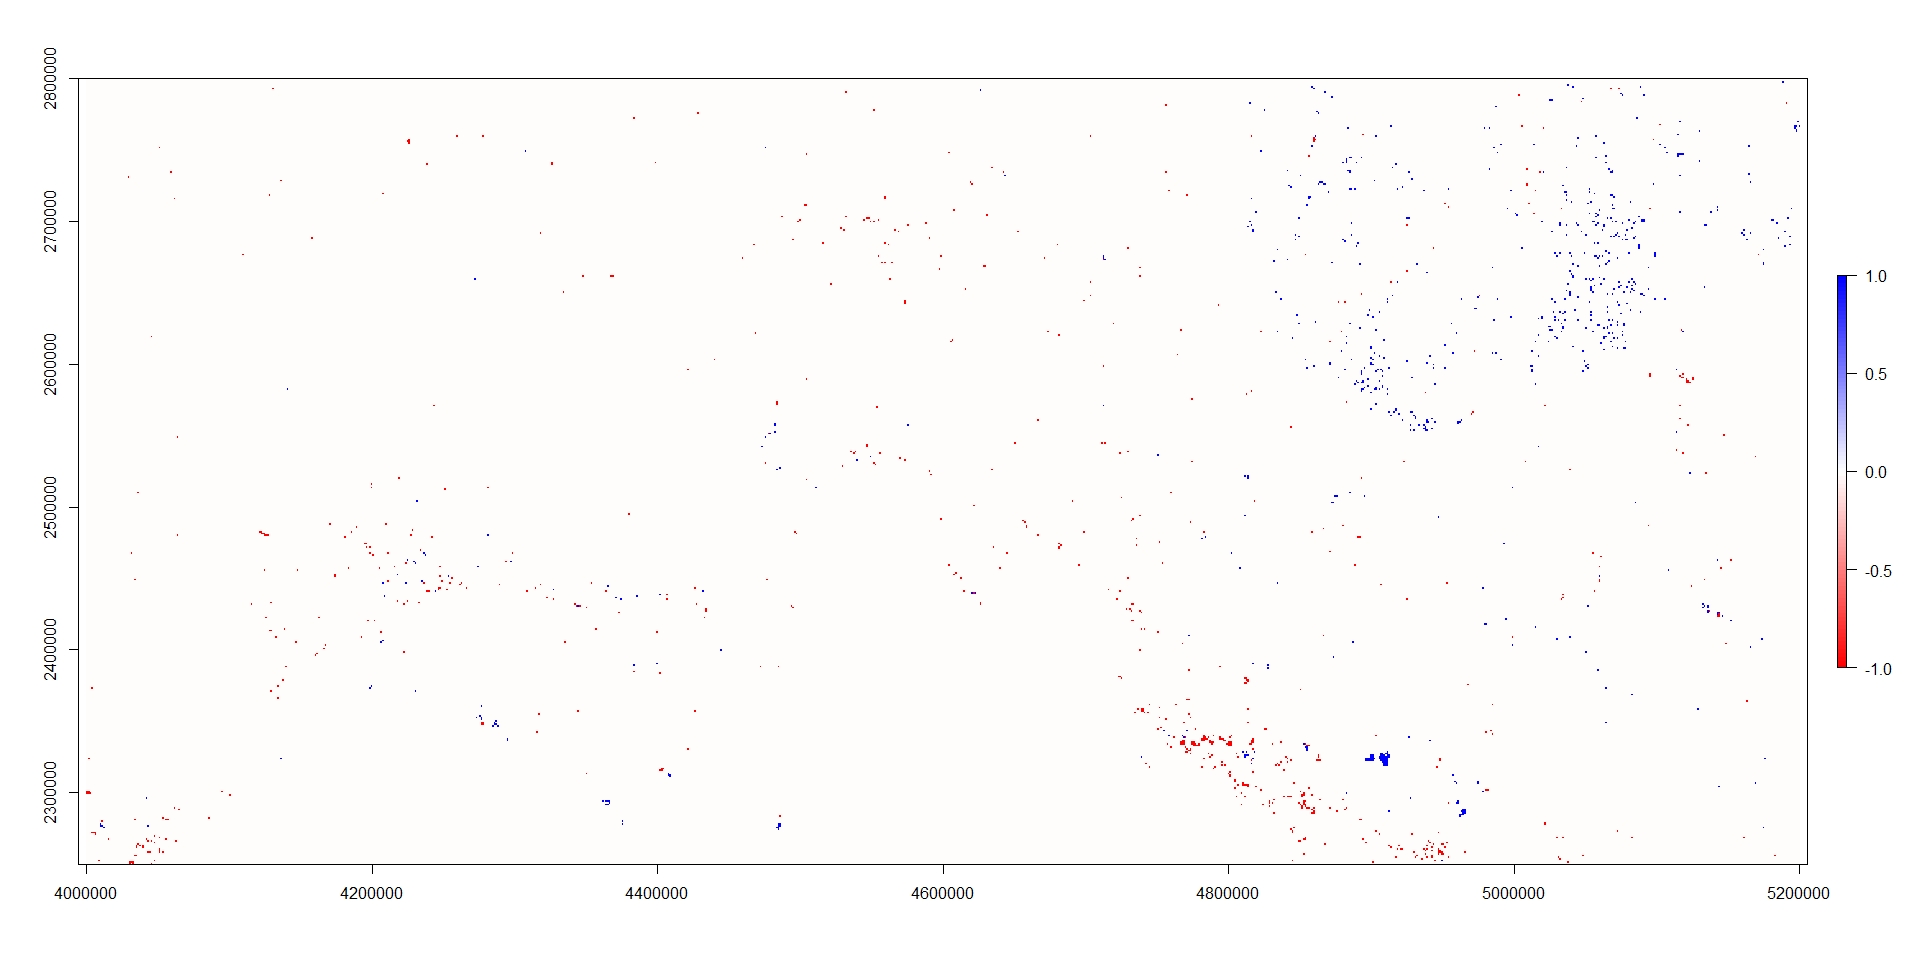
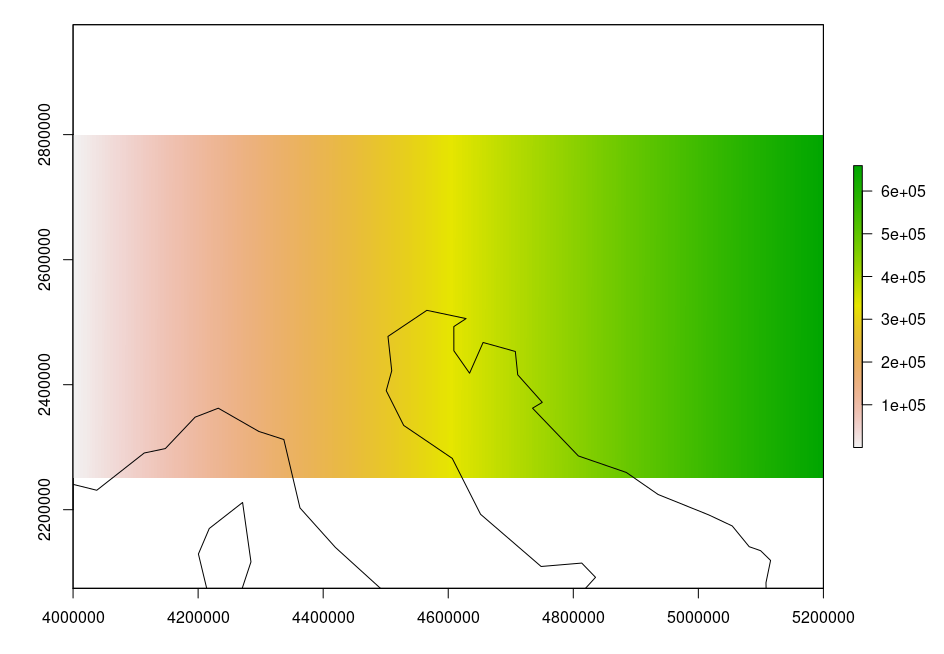
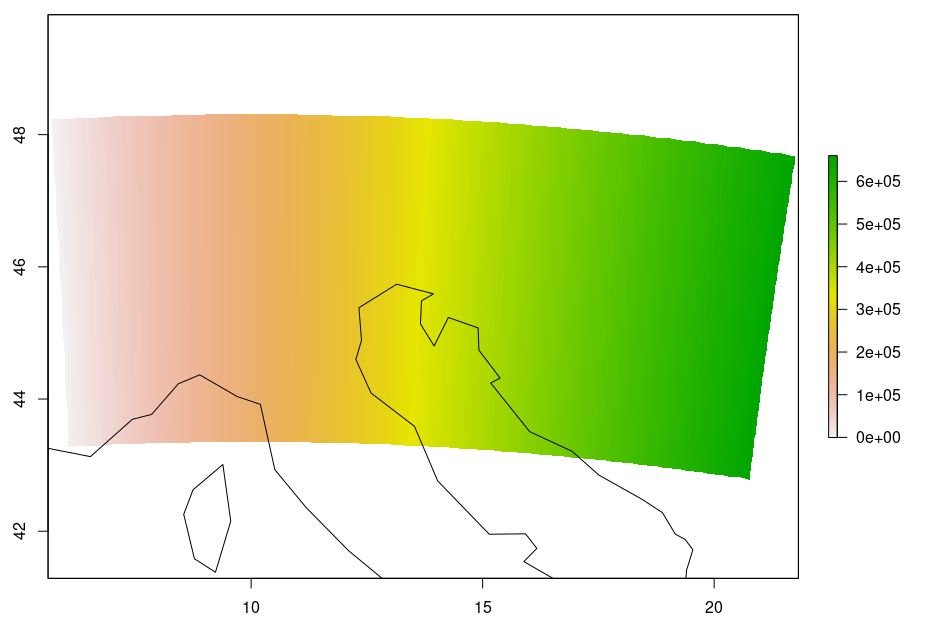
I'm working with raster images. I need to add the european coastline over this plot(fdiff_north) in order to get a more usable image`:

I got this plot by using these codes:
ext <- c(4e+06, 5200000, 2250000, 2800000)
fdiff_north <- crop(fdiff, ext)
cl <- colorRampPalette(c("red","white","blue"))(100)
plot(fdiff_north, col=cl)
fdiff_north:
class      : RasterLayer
dimensions : 5500, 12000, 6.6e+07  (nrow, ncol, ncell)
resolution : 100, 100  (x, y)
extent     : 4e+06, 5200000, 2250000, 2800000  (xmin, xmax, ymin, ymax)
crs        : +proj=laea +lat_0=52 +lon_0=10 +x_0=4321000 +y_0=3210000 +ellps=GRS80 +units=m +no_defs
source     : memory
names      : layer
values     : -1, 1  (min, max)
thats the summary(fdiff_north):
layer
Min.       -1
1st Qu.     0
Median      0
3rd Qu.     0
Max.        1
NA's        0
I found the ne_coastline function but I can't figure how to use it. These are the packages I'm using to do that:
    > install.packages("rnaturalearthdata")
    > library("rnaturalearthdata")
    > install.packages("devtools")
    > devtools::install_github("ropensci/rnaturalearthhires")
    > library("rnaturalearthhires")
On internet I found that example code but I really have non idea how to use it:
if (requireNamespace("rnaturalearthdata")) {
   sldf_coast <- ne_coastline()

   if (require(sp)) {
     plot(sldf_coast)
   }
}


summary(fdiff)so we can get a handle on the projection?summary, maybeprint, some way that we can see the coordinate system (not that it really matters because we can get it with functions but its useful anyway...)