2

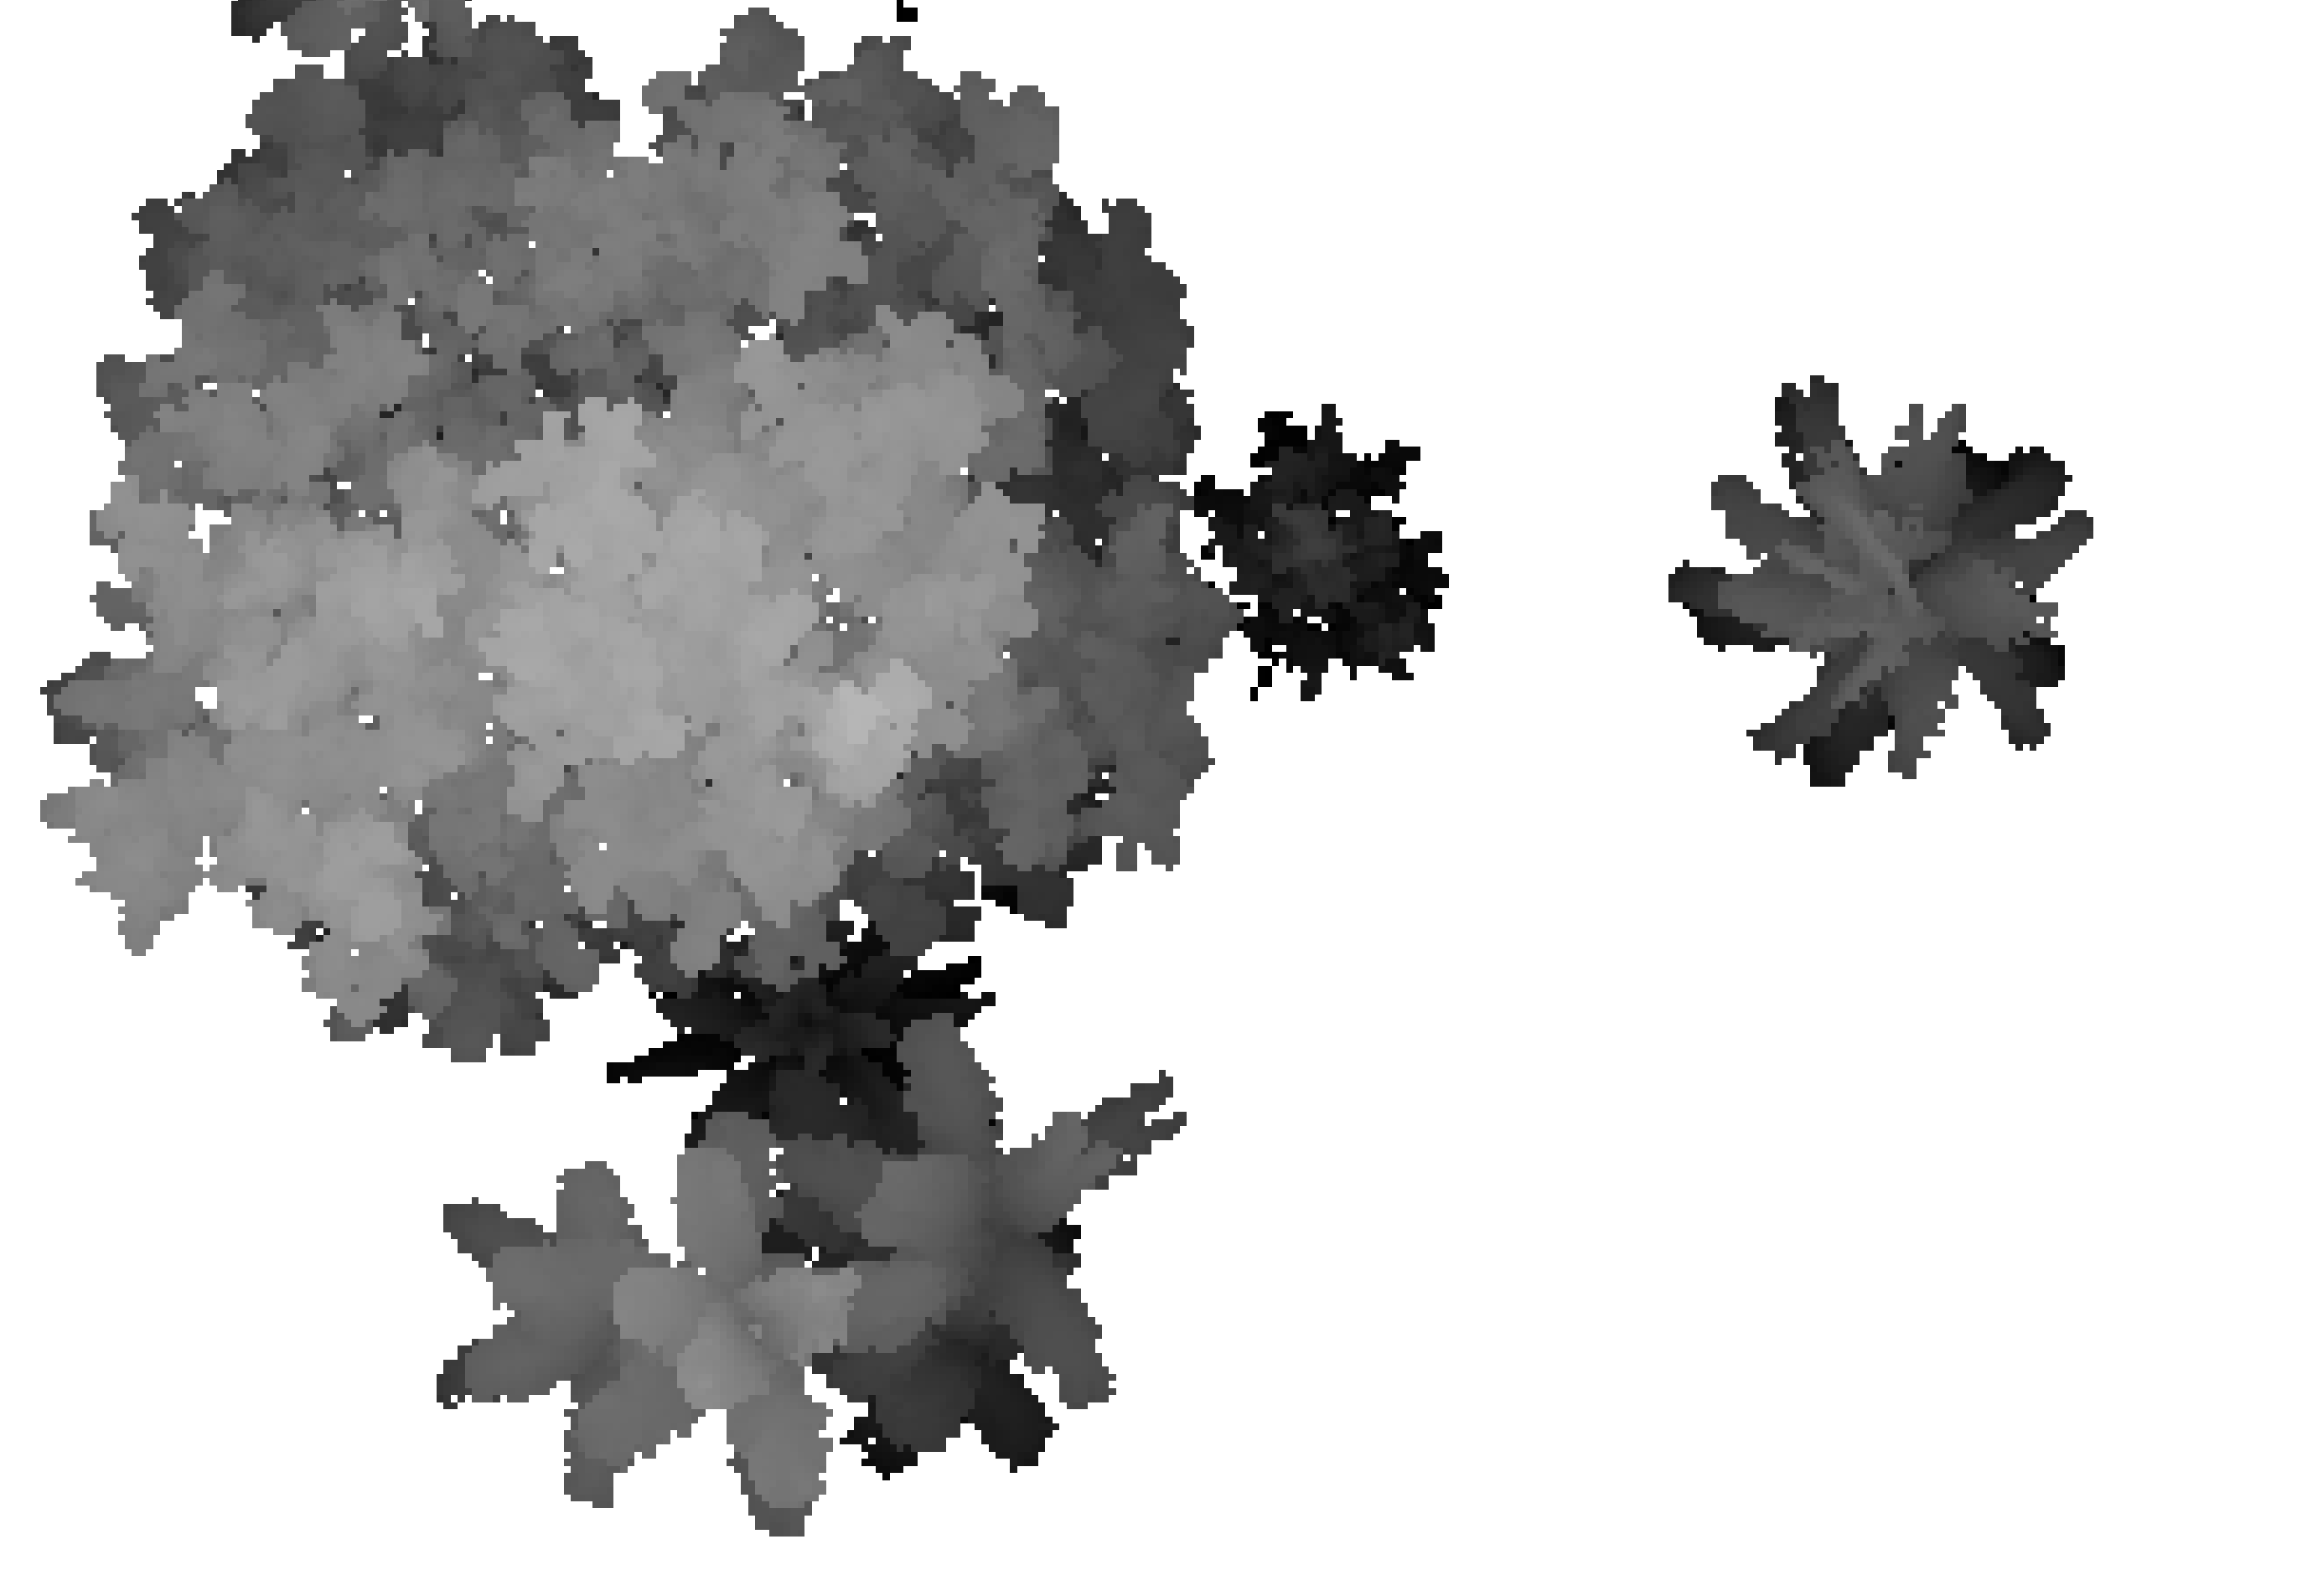
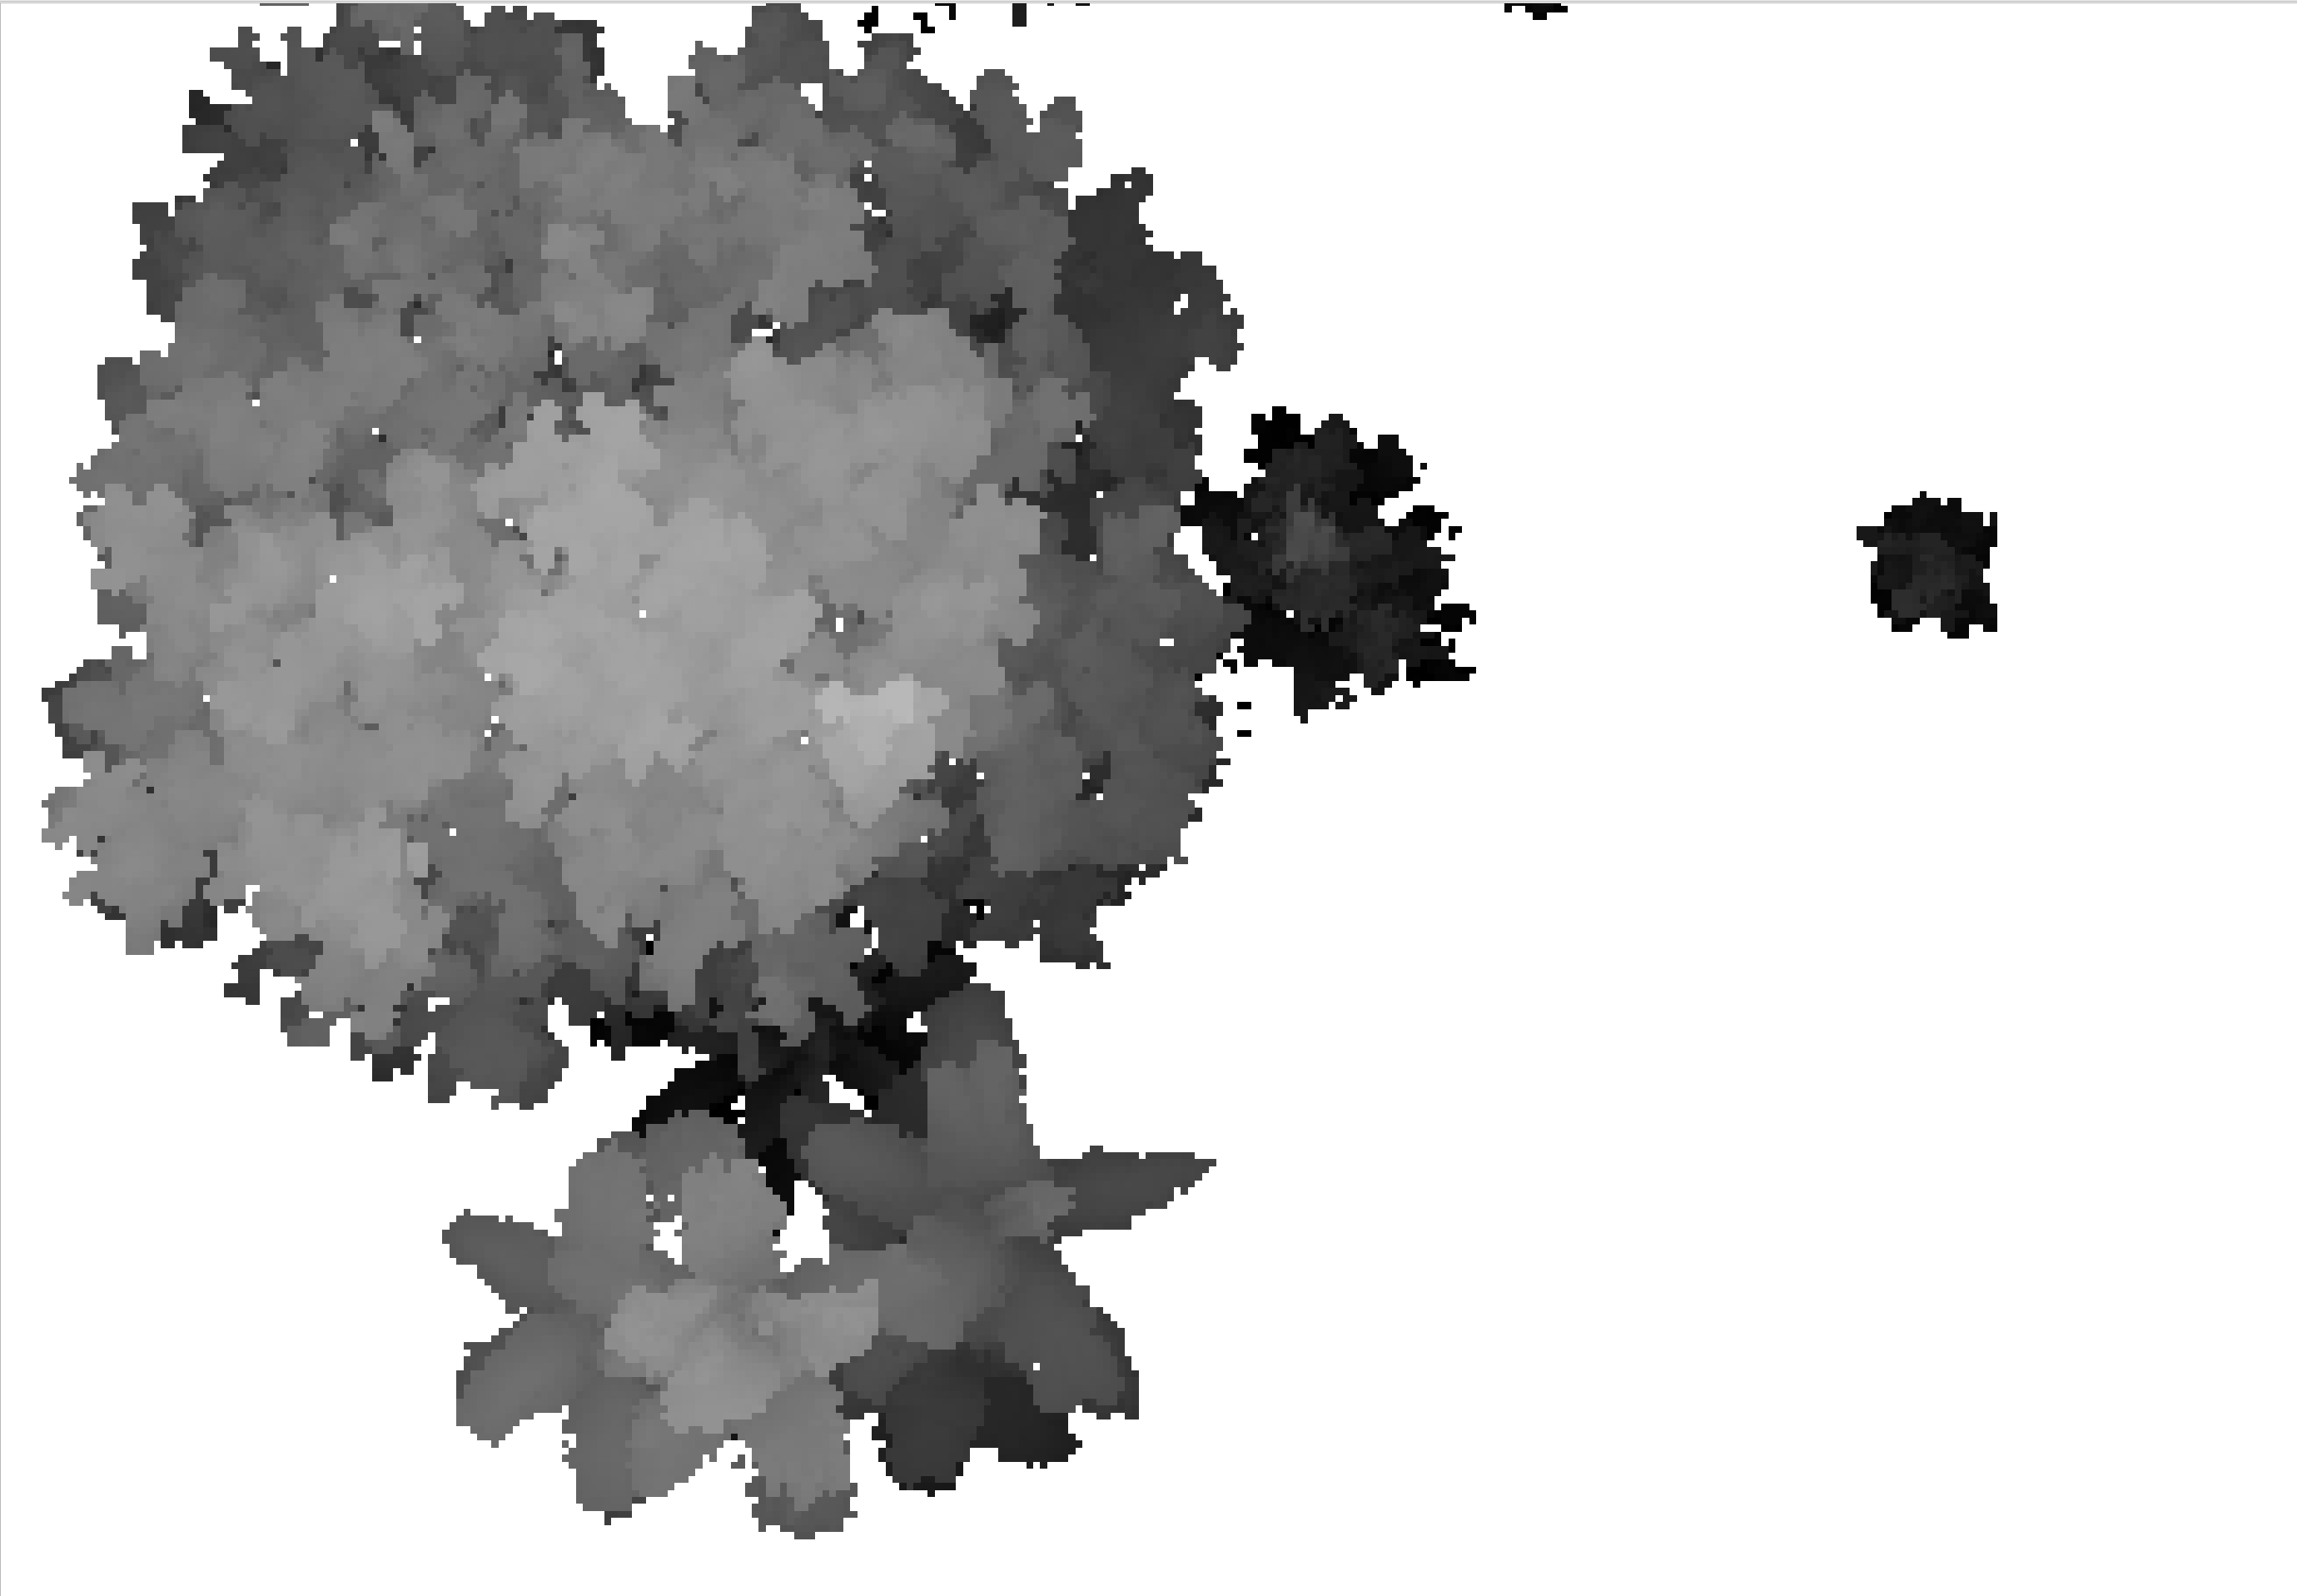
I am using classified LiDAR to create a canopy height model (CHM) for two LiDAR data sets over time. When I create the CHM I use a filter, -keep_class 5 so the output raster exactly outlines the trees of that particular lidar collection.

The boundary of the vegetation changes over time as it grows, so in the second LiDAR data set of the time series study the vegetation outline is wider.

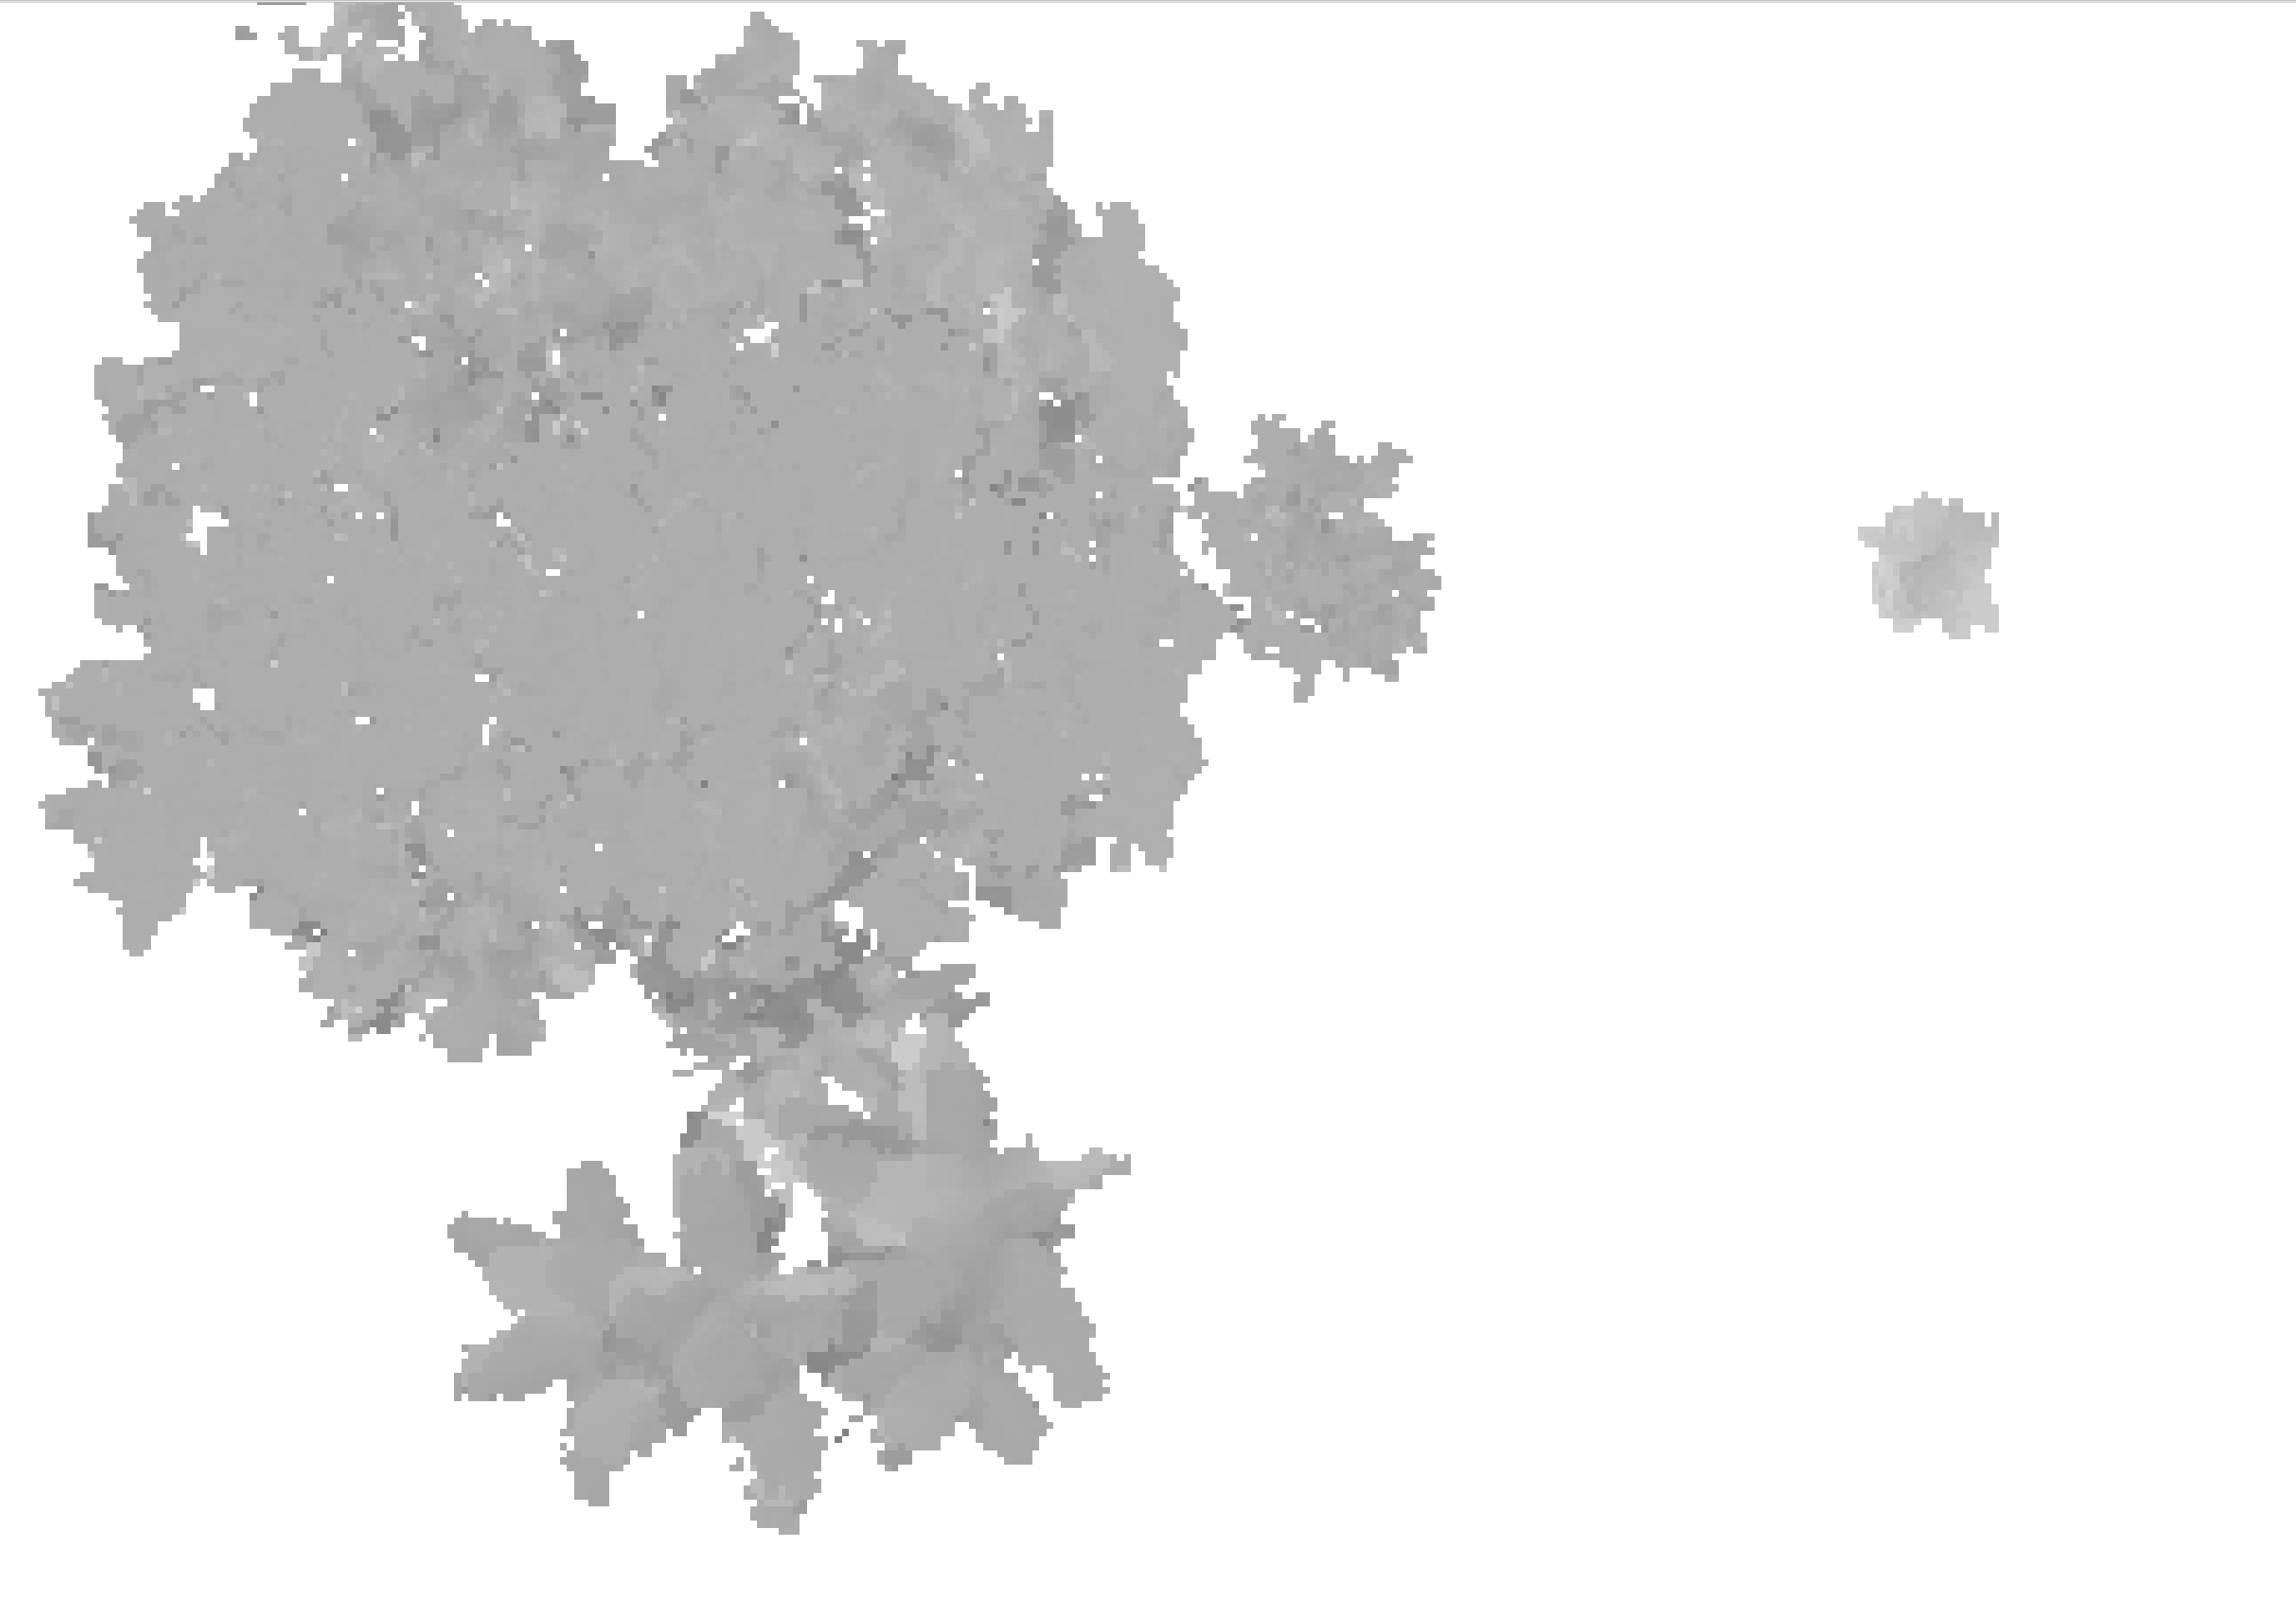
When I difference the two, the difference only considers the smallest boundary. Why is this? I have done differencing in R and QGIS.

Ideally we want to capture the way the tree got bigger over time, but this differencing method (overlay function in R as described here and the raster calculator of QGIS miss this.

If possible I thought of filling in the voids with a USGS DEM, but I am not sure how to do that or if that is the optimal solution to this issue.

Example below:

time series 1 time series 1

time series 2 time series 2

time series difference time series difference

1 Answer 1

2

Since there is no data in the first time series CHM, the second canopy height model does not have any values to do a difference. You should think about this a little deeper.

If your just looking for canopy growth, you should not clip the CHM to the tree crown polys. Calculate CHM for entire scene for both dates. Then you could simply use the poly from time series 2 as the outline to find the difference between two time series. In this case, a difference of zero would indicate no growth, and a difference of x meters would indicate THE CANOPY height grew x meters. If growth is within polys, then you can assume growth was from your selected tree/vegetation.

I was going to say fill in the empty space with zeroes, but in reality there may be vegetation growth underneath the edges of your crown. Lets do a thought experiment. If a pixel on the outer edge of tree crown went from 0 meters to, lets say, 10 meters, thats a big jump. But in reality there could of been an 8 meter tall tree right underneath that you removed and set value to zero, and the other tree foliage/branches grew over it, resulting really in only a 2 meter difference in canopy height.

Sorry if that was a mouthful lol.

For your specific coding/processing question:

You can fill in the empty space using interpolation methods. QGIS GUI is easy using the Raster Fill nodata tool

Another approach, using python, is as simple as this function provided by the Whitebox library FillMissingData

Your Answer

By clicking “Post Your Answer”, you agree to our terms of service and acknowledge you have read our privacy policy.

Not the answer you're looking for? Browse other questions tagged or ask your own question.