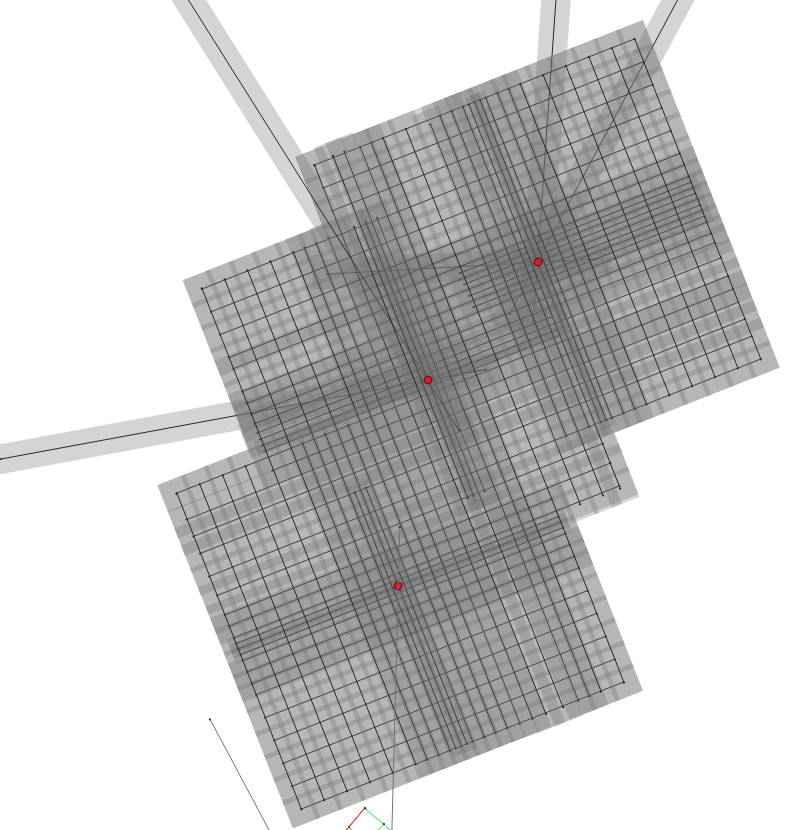
I have a survey line plan (a grid of lines along which to acquire data - dark lines in picture).
Each line images data out to either 150m or 300m from the centre line. I have visualised this by making the 'Simple Line' width the appropriate width based on a column in my data.
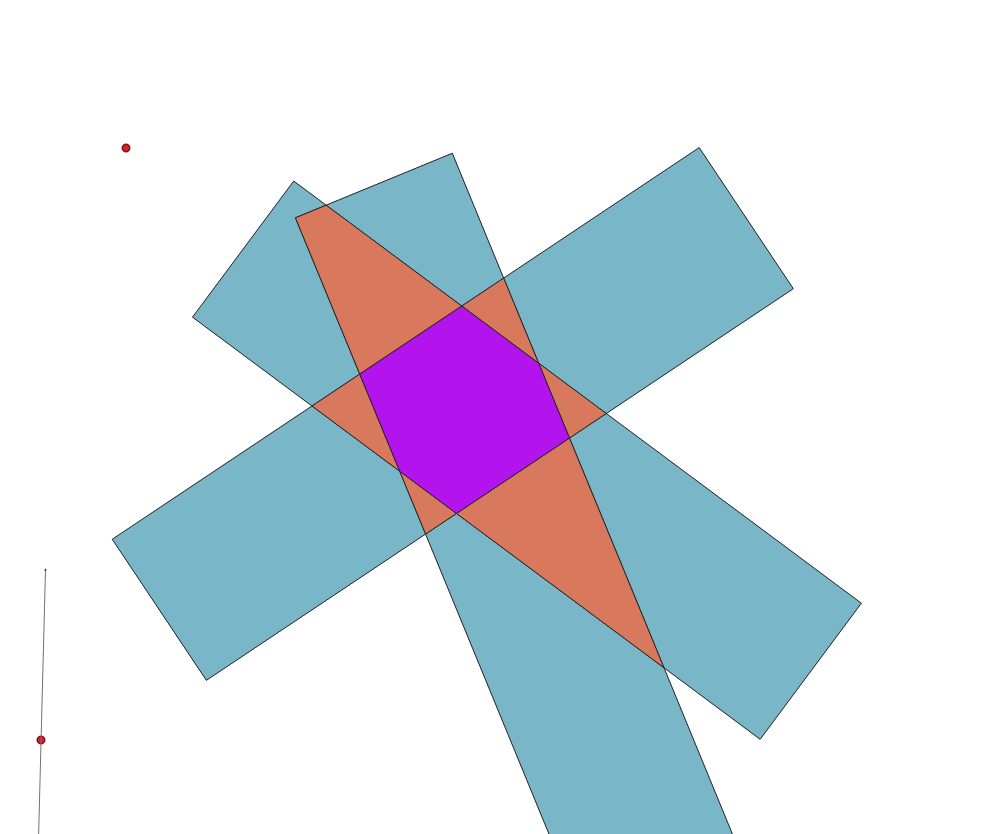
Is is possible to calculate the density of coverage from this? What I want to know is how many times an area is imaged, e.g. 1 pass = only seen once = 100%, 2 passes = seen from 2 passes = 200%, etc.
The lines radiating out will only have 1 pass where they extend beyond the main grid, but may have 500% where they near the site centre.
I don't know if any of the 'line density' options would work as I'm not looking at real data (beyond the line itself), I'm looking at a width projection of the line.
Would I have to create a Polygon of each line?

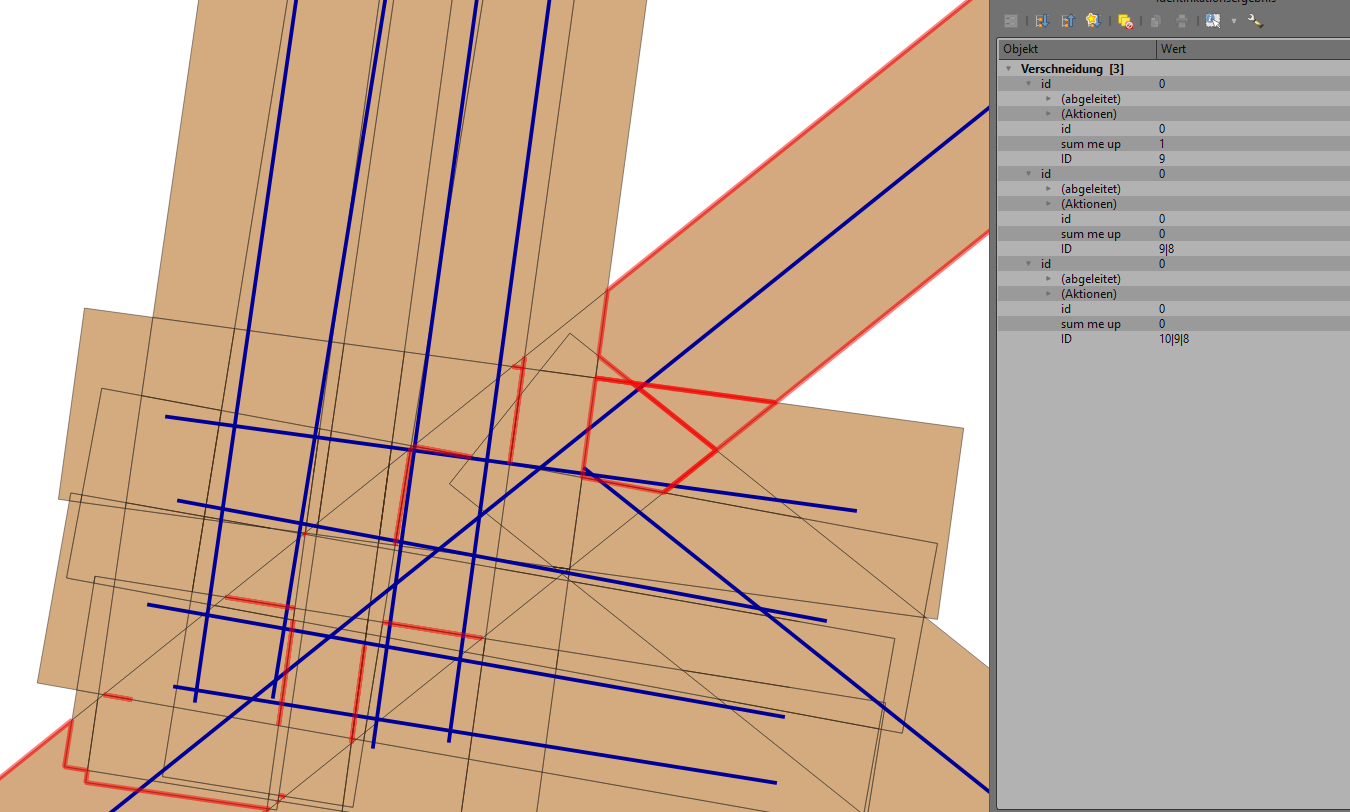
Using Erik's Answer below, I now have categorised coverage density - This is a mini test example for clarity.


