1

Some time ago I posted my own answer to create a grid inside a country to be used in kriging interpolation:

0........0.kriging error messages, grid file problem ? (automap, gstat)

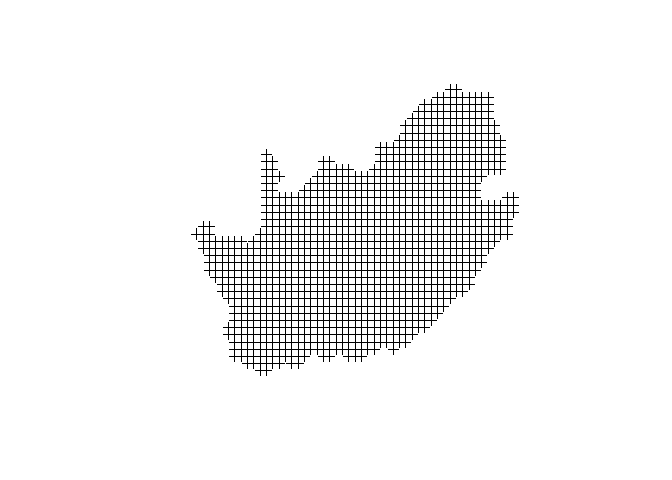
This grid was for South Africa. Now I have data point for Lesotho (the hole inside SA), but cant get around it, to work with both together. I need a joint grid for kriging in gstat.

I used makegrid in sp:

SA0 <- raster::getData("GADM", country = "South Africa", level = 0)
plot(SA0)
SA0grd <- makegrid(SA0, n = 2000)
colnames(SALgrd) <- c('Longitude','Latitude')

SA0grd_pts <- SpatialPoints(coords = SALgrd, 
                    proj4string=CRS(proj4string(SA0)))


SALgrd_pts_in <- SALgrd_pts[SAL0, ]

plot(SALgrd_pts_in)

enter image description here

I tried this , did not worK

SAL0 <- raster::getData("GADM", country = c("South Africa", "Lesotho"), level = 0)

How can I create a grid for SA and Lesotho together?

1 Answer 1

0

It seems like you cannot pass multiple country arguments to raster::getData(), but you could simply merge two individual datasets using rbind():

library(sp)
library(raster)

SA0 <- raster::getData("GADM", country = "South Africa", level = 0)
les <- raster::getData("GADM", country = "Lesotho", level = 0)

sa_full <- rbind(SA0, les)

SA0grd <- sp::makegrid(sa_full, n = 2000)
colnames(SA0grd) <- c('Longitude','Latitude')

SA0grd_pts <- sp::SpatialPoints(coords = SA0grd, 
                                proj4string=CRS(proj4string(sa_full)))

SA0grd_pts_in <- SA0grd_pts[sa_full, ]

plot(SA0grd_pts_in)

Created on 2022-08-05 by the reprex package (v2.0.1)

6
  • Thank you vey much for your respons. Commented Aug 7, 2022 at 9:31
  • Thank you very much for you help, I can get the grid. Commented Aug 7, 2022 at 9:33
  • However I have a problem down the line. I need to convert this to a spatial pixel df to be used in variogtam, kriging, but then the resulting file has the hole of Lesotho in the middle again. crs(SA0grd_pts_in) <- NA SAgNA <- SA0g_pts_in # I change the name to remember I changed the CRS plot(SAgNA) # this plot has Lesotho hole SAgNA_px <- as(SAgNA, "SpatialPixels") class(SAgNA_px) plot(SAgNA_px) Commented Aug 7, 2022 at 9:37
  • k1_kr = autoKrige(percent~1,SALk1b,SAgNA_px ) plot(k1_kr) Commented Aug 7, 2022 at 9:38
  • plot(k1_kr) # show a hole for Lesotho. Commented Aug 7, 2022 at 9:39

Your Answer

By clicking “Post Your Answer”, you agree to our terms of service and acknowledge you have read our privacy policy.

Not the answer you're looking for? Browse other questions tagged or ask your own question.