3

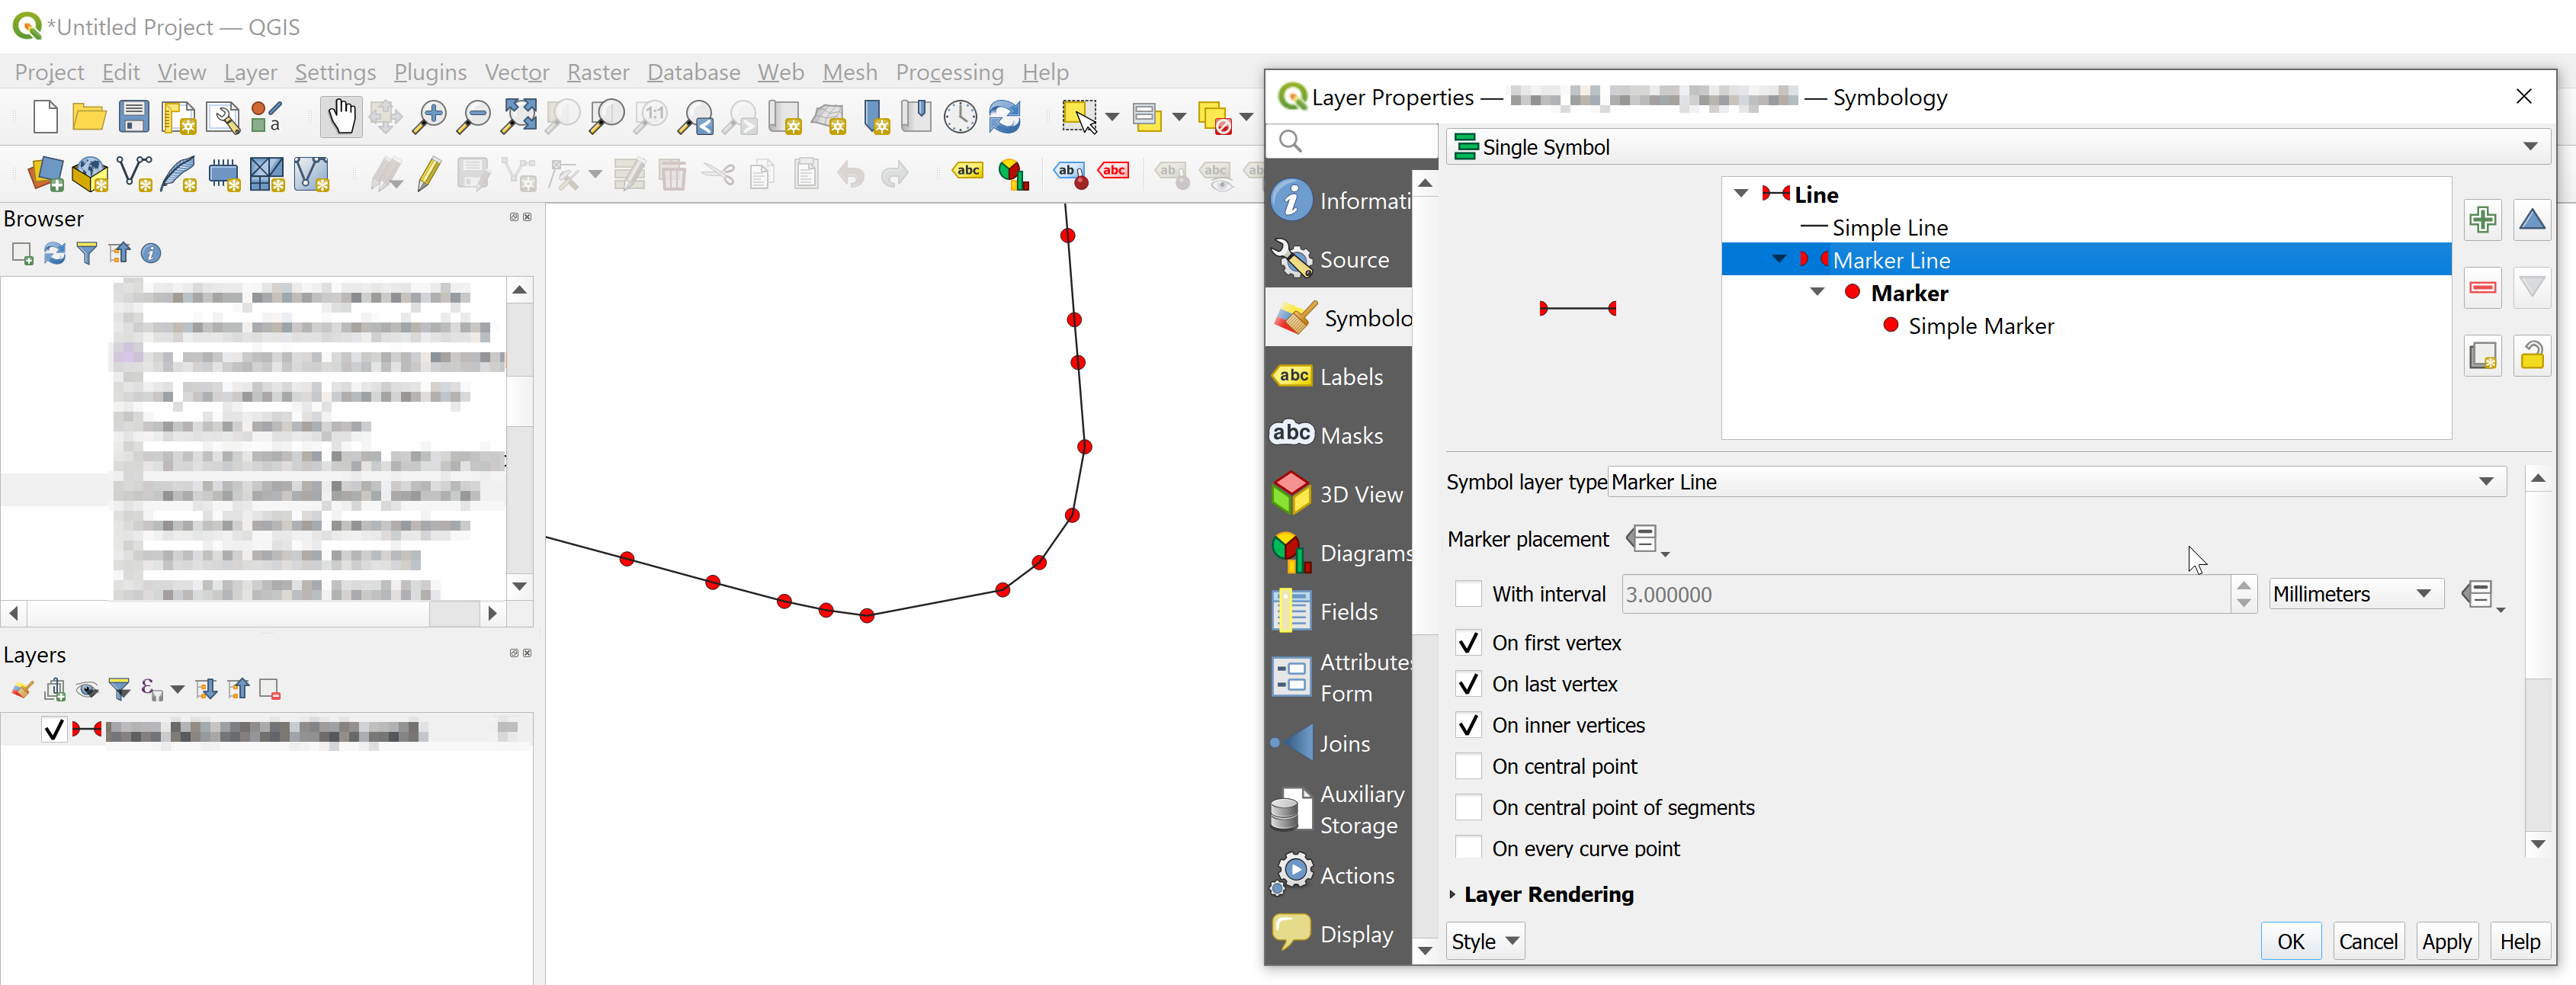
I have a line feature and would like to visualize all vertices. I am able to do this in QGIS (see screenshot) but I am wondering how I can do this in my Leaflet map?

enter image description here

My JavaScript code drawing a simple line:

async function initMap() {

    const map = L.map('map').setView([46.519833, 6.6335], 13);

    L.tileLayer('https://{s}.tile.openstreetmap.org/{z}/{x}/{y}.png', {
        attribution: '© OpenStreetMap'
    }).addTo(map);

    const trackCanvas = L.canvas({
        padding: 0.5
    });

    const response = await fetch(`/tracks/1`);
    const tracks = await response.json();

    const trackLayer = L.geoJSON(tracks[0], {
        style: feature => ({
            color: "#000000",
            weight: 2,
            opacity: 0.7,
            renderer: trackCanvas,
        })
    });

    trackLayer.addTo(map);

}

initMap();

2 Answers 2

2

One possible solution for this would be to create separate group layer for line points and add point markers to this layer when creating track layer. Good practice would also be to hide points when zoom is to low.

Code for this solution could look something like this:

var pointsLayer = L.layerGroup();

var layer = L.geoJSON(geoJsonData, {
  onEachFeature: function(feature, layer) {
    var coords = [];
    if (feature.geometry.type == 'LineString')
      coords[0] = feature.geometry.coordinates;
    else if (feature.geometry.type == 'MultiLineString') {
      coords = feature.geometry.coordinates;
    }
    if (coords.length > 0) {
      coords.forEach(function(coordsArray) {
        var pointsArray = L.GeoJSON.coordsToLatLngs(coordsArray);
        pointsArray.forEach(function(latlng) {
          L.circleMarker(latlng, {radius: 2}).addTo(pointsLayer);
        });
      });
    }
  }
}).addTo(map);

function showHidePoints() {
  if (map.getZoom() > 15) {
    if (!map.hasLayer(pointsLayer)) map.addLayer(pointsLayer);
    }
  else if (map.hasLayer(pointsLayer)) {
    map.removeLayer(pointsLayer);
  }
}

map.on('zoomend', function() {
  showHidePoints();
});

showHidePoints();
0
1

I haven't found a solution using styling but I actually also found a workaround earlier (similar to TomazicM's answer):

  • create a MultiPoint GeoJSON object using the LineString GeoJSON object
  • add to a separate L.geoJSON layer
  • use the same canvas to render the features

Note: I am going to accept TomazicM's answer. His solution can handle LineStrings and MultiLineStrings, and hides the point if small scale, and I just learnt about L.GeoJSON.coordsToLatLngs.

Anyways, here is my workaround:

function createVerticesLayer(track, canvas) {

    const vertices = {
        type: "Feature",
        properties: {
        },
        geometry: {
            type: "MultiPoint",
            coordinates: track.geometry.coordinates
        }   
    };

    const markerOptions = {
        radius: 8,
        fillColor: "#ff7800",
        color: "#000",
        weight: 1,
        opacity: 1,
        fillOpacity: 0.8,
        renderer: canvas,
    };

    const verticesLayer = L.geoJSON(vertices, {
        pointToLayer: (feature, latlng) => {
            return L.circleMarker(latlng, markerOptions);
        }
    });

    return verticesLayer;

}
const map = L.map('map').setView([46.519833, 6.6335], 13);

async function initMap() {

    L.tileLayer('https://{s}.tile.openstreetmap.org/{z}/{x}/{y}.png', {
        attribution: '© OpenStreetMap'
    }).addTo(map);

    const trackCanvas = L.canvas({
        padding: 0.5
    });

    const response = await fetch(`/tracks/1`);
    const tracks = await response.json();

    const trackLayer = L.geoJSON(tracks[0], {
        style: feature => ({
            color: "#000000",
            weight: 2,
            opacity: 0.7,
            renderer: trackCanvas,
        })
    });

    const verticesLayer = createVerticesLayer(tracks[0], trackCanvas);

    trackLayer.addTo(map);
    verticesLayer.addTo(map);

}

initMap();

Addendum: Since I have quite a few points to show/hide when zoom level is changed, I use a separate canvas and overlay pane which I then show and hide using CSS.

Switching from shown to hidden and vice versa feels faster.

const map = L.map('map').setView([44.608317, -63.471079], 13);

const detailOverlayPane = map.createPane('detailOverlayPane');

function createVerticesLayer(track, canvas) {

    // ...

    const verticesCanvas = L.canvas({
        padding: 0.5,
        pane: detailOverlayPane,
    });

    const markerOptions = {
        // ...
        renderer: verticesCanvas,
    };

    // ...

}
async function initMap() {

    // ...

    updateDetailVisibliy();

}

function updateDetailVisibliy() {

    const displayValue = map.getZoom() >= 17 ? 'block' : 'none';
            
    detailOverlayPane.style.display = displayValue;

}

map.on('zoomend', updateDetailVisibliy);

initMap();

Your Answer

By clicking “Post Your Answer”, you agree to our terms of service and acknowledge you have read our privacy policy.

Not the answer you're looking for? Browse other questions tagged or ask your own question.