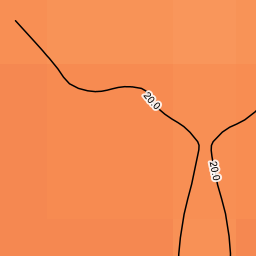
I deployed a GeoServer instance and I published some raster files (netCDF). I then applied the following style that contains both raster colorMap and lineSymbolyzer to show the isocurves:
<?xml version="1.0" encoding="ISO-8859-1"?>
<StyledLayerDescriptor version="1.0.0" xsi:schemaLocation="http://www.opengis.net/sld/StyledLayerDescriptor.xsd" xmlns="http://www.opengis.net/sld" xmlns:ogc="http://www.opengis.net/ogc" xmlns:xlink="http://www.w3.org/1999/xlink" xmlns:xsi="http://www.w3.org/2001/XMLSchema-instance">
<!-- a Named Layer is the basic building block of an SLD document -->
<NamedLayer>
<Name>default_line</Name>
<UserStyle>
<!-- Styles can have names, titles and abstracts -->
<Title>Default Line</Title>
<Abstract>A sample style that draws a line</Abstract>
<!-- FeatureTypeStyles describe how to render different features -->
<!-- A FeatureTypeStyle for rendering lines -->
<FeatureTypeStyle>
<Rule>
<RasterSymbolizer>
<ColorMap>
<ColorMapEntry color="#313695" quantity="-40" label="-40°C"/>
<ColorMapEntry color="#90c3dd" quantity="-20" label="-20°C" />
<ColorMapEntry color="#ffffbf" quantity="0" label="0°C" />
<ColorMapEntry color="#f88d52" quantity="20" label="20°C" />
<ColorMapEntry color="#a50026" quantity="40" label="40°C" />
</ColorMap>
</RasterSymbolizer>
</Rule>
</FeatureTypeStyle>
<FeatureTypeStyle>
<Transformation>
<ogc:Function name="gs:Contour">
<ogc:Function name="parameter">
<ogc:Literal>data</ogc:Literal>
</ogc:Function>
<ogc:Function name="parameter">
<ogc:Literal>smooth</ogc:Literal>
<ogc:Literal>true</ogc:Literal>
</ogc:Function>
<ogc:Function name="parameter">
<ogc:Literal>levels</ogc:Literal>
<ogc:Literal>-30</ogc:Literal>
<ogc:Literal>-10</ogc:Literal>
<ogc:Literal>0</ogc:Literal>
<ogc:Literal>5</ogc:Literal>
<ogc:Literal>10</ogc:Literal>
<ogc:Literal>15</ogc:Literal>
<ogc:Literal>20</ogc:Literal>
<ogc:Literal>25</ogc:Literal>
<ogc:Literal>30</ogc:Literal>
<ogc:Literal>40</ogc:Literal>
<ogc:Literal>50</ogc:Literal>
<ogc:Literal>60</ogc:Literal>
</ogc:Function>
</ogc:Function>
</Transformation>
<Rule>
<Name>rule1</Name>
<Title>Black Line</Title>
<Abstract>A solid blue line with a 1 pixel width</Abstract>
<LineSymbolizer>
<Stroke>
<ogc:Function name="Interpolate">
<CssParameter name="stroke">#000000</CssParameter>
<CssParameter name="stroke-linejoin">round</CssParameter>
<CssParameter name="stroke-linecap">round</CssParameter>
<ogc:Literal>cubic</ogc:Literal>
<!-- Interpolation mode - defaults to linear -->
</ogc:Function>
</Stroke>
</LineSymbolizer>
<TextSymbolizer>
<Label>
<ogc:PropertyName>value</ogc:PropertyName>
</Label>
<Font>
<CssParameter name="font-family">Arial</CssParameter>
<CssParameter name="font-style">Normal</CssParameter>
<CssParameter name="font-size">10</CssParameter>
</Font>
<LabelPlacement>
<LinePlacement></LinePlacement>
</LabelPlacement>
<Halo>
<Radius>
<ogc:Literal>2</ogc:Literal>
</Radius>
<Fill>
<CssParameter name="fill">#FFFFFF</CssParameter>
<CssParameter name="fill-opacity">0.85</CssParameter>
</Fill>
</Halo>
<Fill>
<CssParameter name="fill">#000000</CssParameter>
</Fill>
<VendorOption name="followLine">true</VendorOption>
<VendorOption name="repeat">200</VendorOption>
<VendorOption name="maxDisplacement">50</VendorOption>
<VendorOption name="maxAngleDelta">30</VendorOption>
<VendorOption name="group">no</VendorOption>
</TextSymbolizer>
</Rule>
</FeatureTypeStyle>
</UserStyle>
</NamedLayer>
</StyledLayerDescriptor>
The preview of layer in Geoserver dashboard is pretty satysfing:

But then I tried to link my geoserver to mapbox that uses only EPSG:3857 projection and it doesn't show the isocurve:

Even editing the style and removing the colorMap section, the isocurves are displayed but not interpolated.
I don't have any clue on how to solve this. Has anyone else experienced this? How can I solve?
NOTE: The images that I have attached are returned by the very same WMS request, the only differences are the srs and bbox parameters

t2m