2

I am working with the R programming language.

I am trying to recreate this map here myself : https://crtc.gc.ca/cartovista/LTEOverTheYearsYE2019_EN/index.html (e.g. for 2019)

First, I downloaded the JSON for 2019:

library(jsonlite)
library(httr)


response <- GET("https://crtc.gc.ca/cartovista/LTEOverTheYearsYE2019_EN/map/LTE_YE2019.json")

content <- content(response, as = "text")

data <- fromJSON(content)

Next, I tried to extract the longitude/latitude for all the polygons in this file and convert them into the correct Coordinate Reference System:

library(sp)
library(rgdal)

polygons <- lapply(LTE_YE2019$f$g$c[[1]], function(x) {
  Polygon(matrix(x, ncol = 2, byrow = TRUE))
})

sp_polygons <- SpatialPolygons(list(Polygons(polygons, ID = 1)))


spdf <- SpatialPolygonsDataFrame(sp_polygons, data.frame(id = 1, row.names = 1))

proj4string(spdf) <- CRS(LTE_YE2019$proj)

The file now looks something like this:

> str(spdf)
Formal class 'SpatialPolygonsDataFrame' [package "sp"] with 5 slots
  ..@ data       :'data.frame': 1 obs. of  1 variable:
  .. ..$ id: num 1
  ..@ polygons   :List of 1
  .. ..$ :Formal class 'Polygons' [package "sp"] with 5 slots
  .. .. .. ..@ Polygons :List of 606

....

  .. .. .. .. .. [list output truncated]
  .. .. .. ..@ plotOrder: int [1:606] 321 322 324 329 330 325 372 290 267 373 ...
  .. .. .. ..@ labpt    : num [1:2] 994419 305033
  .. .. .. ..@ ID       : chr "1"
  .. .. .. ..@ area     : num 1.17e+11
  ..@ plotOrder  : int 1
  ..@ bbox       : num [1:2, 1:2] -2319216 -307601 2981680 3014094
  .. ..- attr(*, "dimnames")=List of 2
  .. .. ..$ : chr [1:2] "x" "y"
  .. .. ..$ : chr [1:2] "min" "max"
  ..@ proj4string:Formal class 'CRS' [package "sp"] with 1 slot
  .. .. ..@ projargs: chr "+proj=lcc +lat_0=49 +lon_0=-95 +lat_1=49 +lat_2=77 +x_0=0 +y_0=0 +ellps=GRS80 +units=m +no_defs"
  .. .. ..$ comment: chr "PROJCRS[\"unknown\",\n    BASEGEOGCRS[\"unknown\",\n        DATUM[\"Unknown based on GRS80 ellipsoid\",\n      "| __truncated__
  ..$ comment: chr "FALSE"

My Question: When I try to plot this, I get the following error:

library(leaflet)

m <- leaflet() %>%
  addTiles() %>%
  addPolygons(data = spdf)

#Error in rgeos::createPolygonsComment(pgons) : 
  #rgeos_PolyCreateComment: orphaned hole, cannot find containing polygon for hole at index 2

I tried to read more about what might be causing this error (e.g. Fixing orphaned holes in R) and tried to follow the advice provided there:

report <- clgeo_CollectionReport(spdf)
summary <- clgeo_SummaryReport(report)
issues <- report[report$valid == FALSE,]

spdf.clean <- clgeo_Clean(spdf)

However I am not sure if this is working because it still says 0% after having run for some time:

 spdf.clean <- clgeo_Clean(spdf)

  |                                                  | 0 % ~calculating  

Can someone tell me if I am doing this correctly?

0

1 Answer 1

8

These numbers aren't the coordinate values. It seems the data may be a starting position, and then a bunch of x and y deltas (differences). If you read the data into matrices and inspect, for example, the 222nd element:

> polygons <- lapply(LTE_YE2019$f$g$c[[1]], function(x) {matrix(x, ncol = 2, byrow = TRUE)})
> polygons[[222]]
          [,1]   [,2]
 [1,] -2133041 525961
 [2,]    -1011    523
 [3,]    -1011    522
 [4,]    -1011    523
 [5,]    -1011    524
 [6,]    -1010    523
 [7,]     -368   -710
 [8,]     -368   -710
 [9,]     -368   -710
[10,]     -369   -711
[11,]     -368   -710
[12,]     1012   -524
[13,]     1011   -524
[14,]     1012   -523
[15,]     1012   -523
[16,]     1012   -524
[17,]      367    711
[18,]      367    711
[19,]      368    711
[20,]      367    710
[21,]      367    711

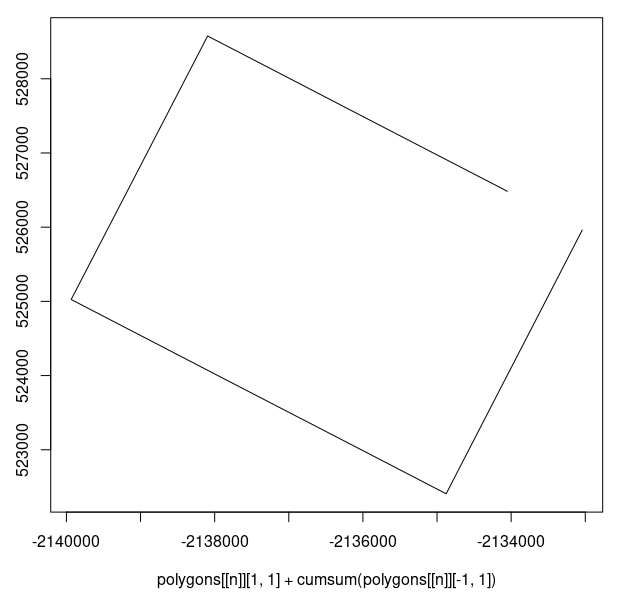
its clear the first row is something different. Assuming row 1 is an offset and the rest are differences, you can plot using cumsum to add up the deltas on the way, something like:

n = 222
plot(polygons[[n]][1,1]+cumsum(polygons[[n]][-1,1]), polygons[[n]][1,2] + cumsum(polygons[[n]][-1,2]), type="l")

enter image description here

if that looks correct, then you should be able to construct the 2-column matrix to feed into a spatial data package...

Talking of which, you should probably use sf instead of sp:

library(sf)
library(sfheaders) # useful shortcut functions in this pkg

# make that conversion into a function:
pn = function(p, n){sf_polygon(cbind(p[[n]][1,1]+cumsum(p[[n]][-1,1]), p[[n]][1,2] + cumsum(p[[n]][-1,2])))}

# convert polygon matrices to polygon features:    
sfs = lapply(1:length(polygons), function(i){pn(polygons, i)})
# bind into a data frame
sfdf = do.call(rbind, sfs)
# plot
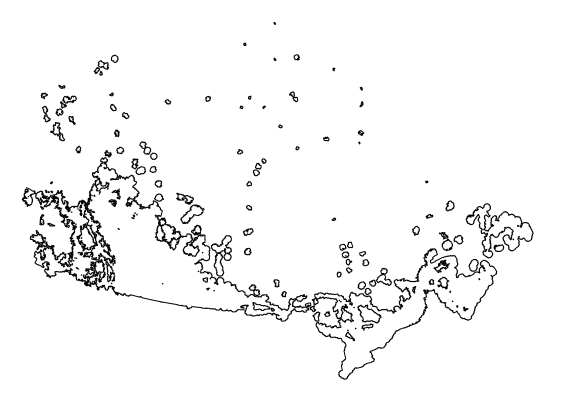
plot(st_geometry(sfdf))

enter image description here

Look good? Now feed into leaflet, or whatever.

8
  • @ Spacedman: thank you so much for your answer! In your opinion, are the polygons in the shape of "hexagons" this example? Thank you so much!
    – stats_noob
    Commented Jun 19, 2023 at 13:03
  • Polygon 222 has 21 points, which is not a hexagon, although a lot of them are co-linear, so it looks more like a rectangle.
    – Spacedman
    Commented Jun 19, 2023 at 13:13
  • @ spacedman: thank you so much for your reply. I have been trying to understand how "access to internet" is recorded in Canada. I found these sources that have information on different geographical maps that are being used:
    – stats_noob
    Commented Jun 19, 2023 at 16:20
  • 1) General Data Source: crtc.gc.ca/eng/publications/reports/policymonitoring/cmrd.htm
    – stats_noob
    Commented Jun 19, 2023 at 16:21
  • 2) Hexagon Grid (no shapefile included): open.canada.ca/data/en/dataset/…
    – stats_noob
    Commented Jun 19, 2023 at 16:21

Your Answer

By clicking “Post Your Answer”, you agree to our terms of service and acknowledge you have read our privacy policy.

Not the answer you're looking for? Browse other questions tagged or ask your own question.