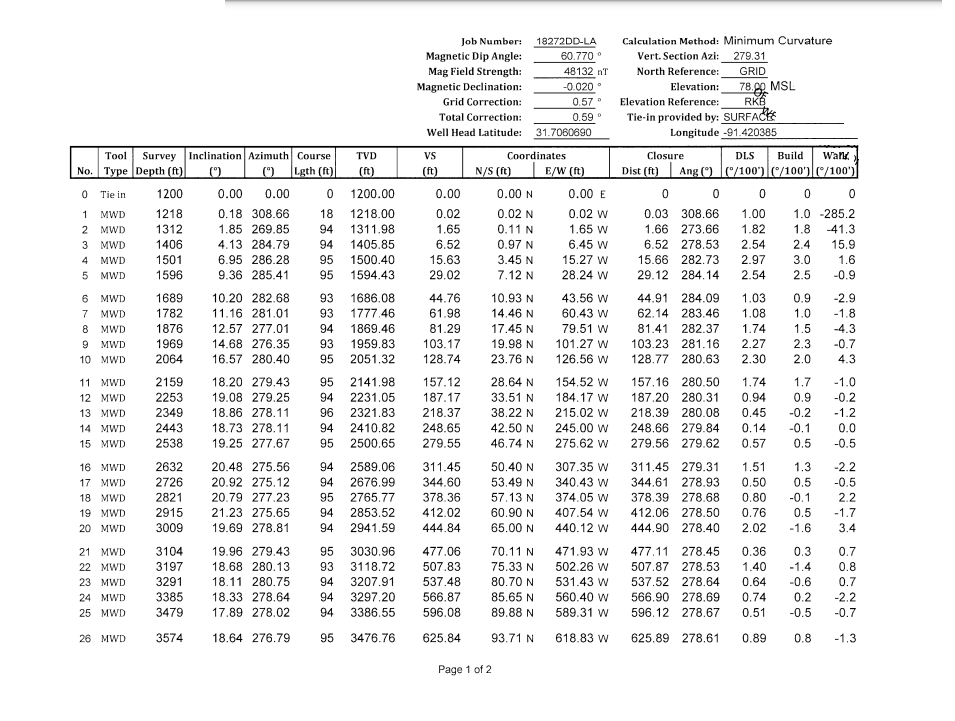
Try using the Azimuth and Distance Plugin as in this answer. After installation it can be accessed via Plugins > Topography.
You will just need to extract your azimuth and distances (presumably "course length") and save only those two columns as a semicolon-delimited csv (not comma-delimited).
Here is what I tried using the data you provided:
Step 1
Extract azimuth and distances to a semicolon-delimited .csv (opened in a text editor below):

Step 2
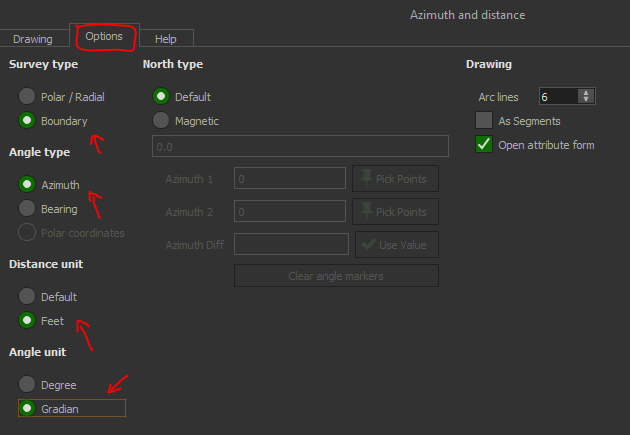
Open the plugin. Under Options, configure the Survey Type as Boundary, Angle Type as Azimuth, Distance Unit as Feet, and Angle Unit as Gradian.
Step 3
Under the Drawing tab, import the .csv from earlier. If it works correctly you should see it populate the table. If not try and review your csv. Open it in a text editor if needed to double check the formatting.
Choose the active layer (must be linestring geometry) to draw on, or a memory layer, and select a starting point.
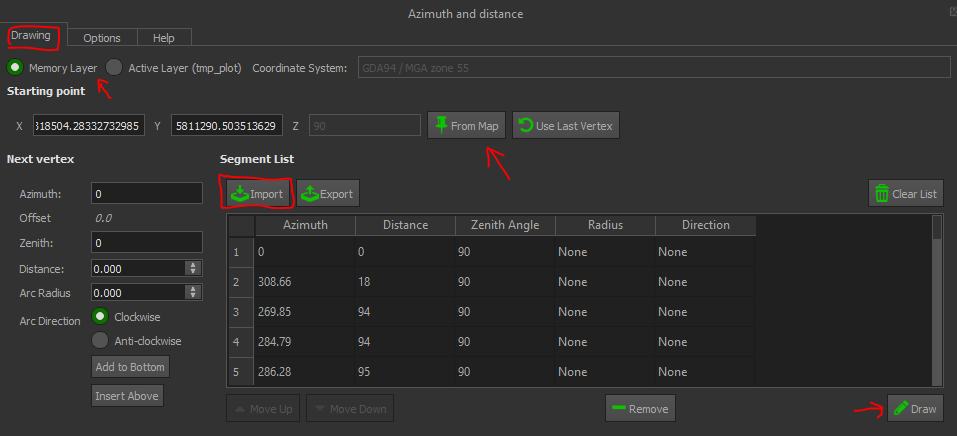
Step 4
Click 'Draw'. You may see a popup box that has nothing in it, just ignore it.
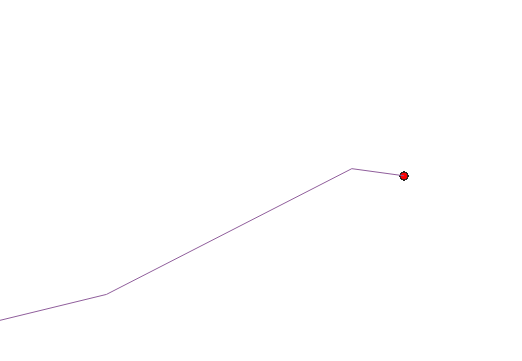
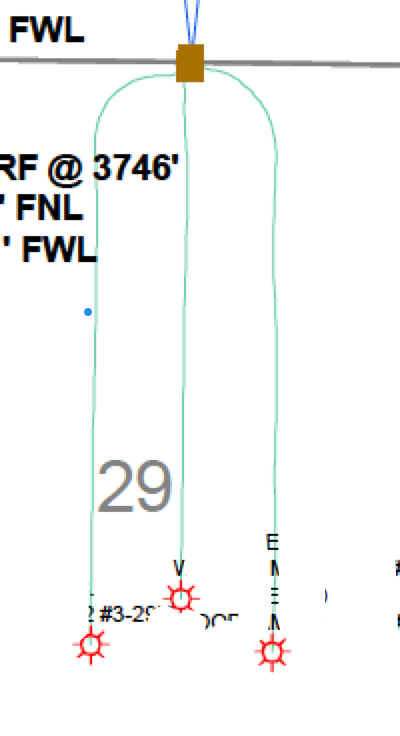
This is the result I got (keep in mind I'm using the wrong CRS and made up a point).
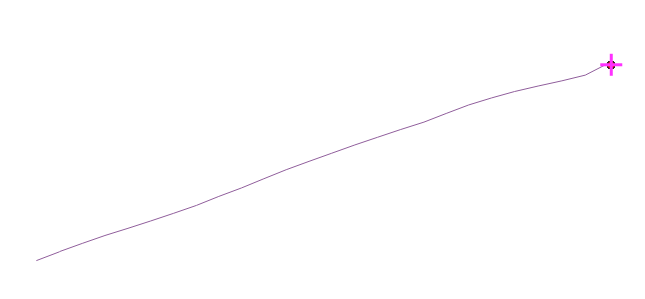
Closeup of the start:
