4

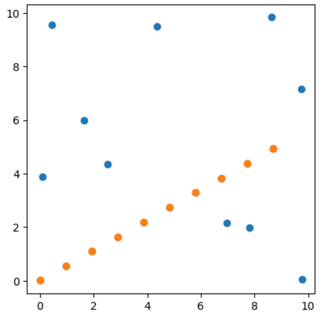
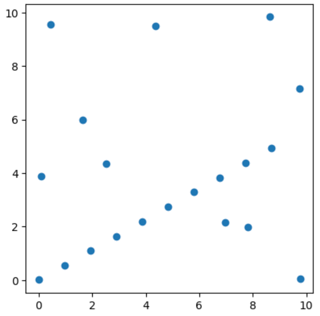
I have 20 points, 10 of them are roughly on an imaginary line, roughly equidistant from each other. This is a simplified version of a real world problem. The following Python script provides a reproducible example.

import matplotlib.pyplot as plt
import geopandas as gpd
import numpy as np
import shapely

np.random.seed(4)

rand = np.random.uniform

xstep=rand(0,1)
ystep=rand(0,1)

points = [(i*xstep,i*ystep) for i in range(10)] # generate 10 points appearing in a sequence
points += [(rand(0,10),rand(0,10)) for _ in range(10)] # add some other points

noise = 0.01
points = [(x+rand(0,noise),y+rand(0,noise)) for (x,y) in points] # add some noise

points = [shapely.geometry.Point(each) for each in points]

gs = gpd.GeoSeries(points)
gs = gs.sample(frac=1).reset_index(drop=True) # reshuffle

ax = gs.plot()

The above script produces this plot:

enter image description here

while gs is:

0     POINT (8.70724 4.93133)
1     POINT (6.98104 2.16592)
2     POINT (8.63631 9.83592)
3     POINT (9.73452 7.14995)
4     POINT (0.96876 0.54798)
5     POINT (1.94007 1.09614)
6     POINT (9.76961 0.06484)
7     POINT (1.64340 5.97516)
8     POINT (2.53537 4.35416)
9     POINT (4.84037 2.73724)
10    POINT (0.09904 3.87003)
11    POINT (0.00786 0.00866)
12    POINT (7.74025 4.38436)
13    POINT (7.80278 1.98048)
14    POINT (5.80376 3.28885)
15    POINT (6.77445 3.83700)
16    POINT (4.37051 9.49382)
17    POINT (2.90842 1.64578)
18    POINT (0.44990 9.57070)
19    POINT (3.87340 2.19830)

To a human, it is obvious which 10 points are on a line. These 10 orange points:

enter image description here

I would like to find these colinear points in a scriptable way, knowing only the coordinates of the 20 points. I don't need the solution to be using Python at all.

How can I find which points lie on a line?


One possible approach

This option is quite tedious. One can calculate the distance matrix for gs:

distance_matrix = gs.geometry.apply(lambda g: gs.distance(g))

We can round the results, and observe which values are repated:

import pandas as pd
s = pd.Series(distance_matrix.to_numpy().flatten().round(int(np.abs(np.log10(noise))-1)).flatten())
s[s.gt(0)].value_counts().head(10)

Giving us:

3.3    20
2.2    18
1.1    18
4.4    16
5.6    14
5.5    12
7.1    10
7.8    10
6.7    10
5.0     8
dtype: int64

From here, we can deduce that the distance between the sought after points is roughly 1.1. We can then select the special 10 points from gs:

index_of_points_on_line = distance_matrix[distance_matrix.round(int(np.abs(np.log10(noise))-1)).eq(1.1).apply(any)].index
pointsOnLine = gpd.GeoSeries([gs[e] for e in index_of_points_on_line])
ax = gs.plot()
pointsOnLine.plot(ax=ax)

Giving us the plot above with the orange points. (index_of_points_on_line is Int64Index([0, 4, 5, 9, 11, 12, 14, 15, 17, 19], dtype='int64'), the index of the 10 on-line points in gs.)


Motivation

I read this Bellingcat article about geolocation of wind turbines (using this image). I would like to see if there is a way to make these kind of geolocations easier by using the fact that the wind turbines we are after are not just distributed randomly, but are roughly along a straight line.

5
  • Draw line between all pairs of points and find minimum of distances to line? Or maximum of points within certain threshold
    – FelixIP
    Commented Mar 15 at 22:44
  • Which line? I don't in advance know where the line is.
    – zabop
    Commented Mar 15 at 22:46
  • For 20 points it is going to be 190 lines to test.
    – FelixIP
    Commented Mar 15 at 22:48
  • Oh I haven't tought of this approach - 190 lines are managable. Good idea!
    – zabop
    Commented Mar 15 at 22:53
  • Compute the parameters of those 190 lines (slope, intercept) and then cluster them in line parameter space. A cluster of lines with similar slope and intercept must come from points that are co-linear. Trick is to find a distance measure for (slope, intercept) because Pythagoras isn't appropriate. I'd think up another parameterisation but maybe later...
    – Spacedman
    Commented Mar 15 at 23:31

2 Answers 2

4

A solution is given in Find clusters of collinear points from a given set of data points, with the slopes and without computing distance, but there are floating points problems with your data.

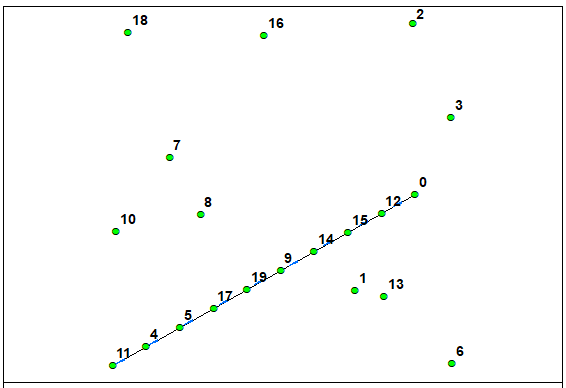
Another solution is to use the properties of the cross product to check if two vectors are collinear (parallel): the cross product must be equal to 0 (1 = perpendicular vectors))

If I use all the combinations of 3 points in your data (with itertools)

import itertools
import numpy as np
from shapely.geometry import LineString
pts = np.array([list(pt.coords)[0] for pt in points])
pt=[]
for x, y, z in itertools.combinations(pts, 3):
   cross = np.cross(z-x,z-y) # cross product of two vectors
   if cross >=0 and cross < 0.005:  # for floating point problems
         # elimination of redundant points
         if list(x) not in pt: pt.append(list(x))
         if list(y) not in pt: pt.append(list(y))
         if list(z) not in pt: pt.append(list(z))

line = LineString(sorted(pt)
print(line)
LINESTRING (0.0078630598593506 0.008662892985817, 0.9687614932286361 0.5479817350458533, 1.9400671052411311 1.0961442201886287, 2.908423318716136 1.645781186128687, 3.873398444288886 2.1983047125423987, 4.840366156292832 2.737243179707484, 5.803761268153909 3.288845521571366, 6.774452913896422 3.837001846671316, 7.740253666545316 4.384356044495972, 8.707237551152106 4.931329403716983)

enter image description here

But this solution depends on the distribution of the points and sometimes does not work well. As and alternative, you can compare the slopes or the angles or the length of the segments between the points, for example

def get_slope(p1,p2): return (p2[1] - p1[1])/(p2[0] - p1[0])
def get_angle(p1, p2): return np.arctan2((p2[1] - p1[1]), (p2[0] - p1[0]))%np.radians(360)
def get_length(p1,p2): return np.linalg.norm(p1-p2)

for pt1,pt2 in itertools.combinations(pts,r=2):
    slope  = get_slope(pt1, pt2)
    angle = get_angle(pt1,p2)
    length = get_length(p1,p2)

    ........
1
  • I like the concise function defns in the 2nd alternate. Just better trap for atan2(,) explosion when line is vertical....unless atan2() is itself graceful. Commented Mar 19 at 23:44
3

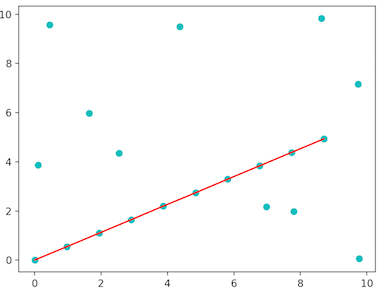
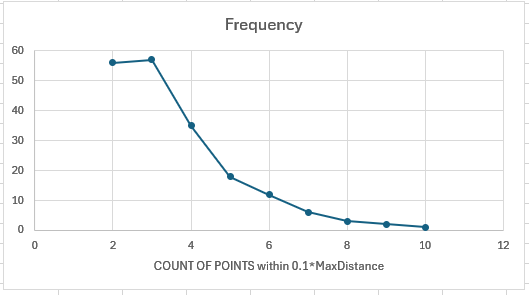
To test the idea I computed 190 lines and count a number of points with distance to line less than 0.1 of maximum distance. Picture shows this distribution:

enter image description here

Only 1 line between points 0 and 11 has 10 points within that interval: enter image description here

Others have fewer points that close.

3
  • Just trying to understand your answer. You say you computed a 190 lines. Why 190 and from what? I'm not a mathematician so it's not immediately clear to me what you have done and why?
    – Hornbydd
    Commented Mar 17 at 16:19
  • For 20 points, 190 is count of all possible pairs. In itertools it is combinations(range (20),2). So 1 line per pair
    – FelixIP
    Commented Mar 17 at 18:27
  • Ok, got you, thanks. Now I understand the logic.
    – Hornbydd
    Commented Mar 17 at 23:42

Your Answer

By clicking “Post Your Answer”, you agree to our terms of service and acknowledge you have read our privacy policy.

Not the answer you're looking for? Browse other questions tagged or ask your own question.