2

I am trying to display a map of European river network on a Leaflet map, using as data source the EUHydro layer published by CLMS (here is the webpage, and the WMS GetCapabilities document).

Here is the code I wrote for now:

const mapOptions = {};

const map = L.map('map', mapOptions).setView([44.76, 28.10], 8);

L.tileLayer('https://tile.openstreetmap.org/{z}/{x}/{y}.png', {
  maxZoom: 19,
  attribution: '&copy; <a href="http://www.openstreetmap.org/copyright">OpenStreetMap</a>',
}).addTo(map);

const EUHydroURL = 'https://image.discomap.eea.europa.eu/arcgis/services/EUHydro/EUHydro_RiverNetworkDatabase/MapServer/WMSServer?';

const wmsOptions = {
  layers: '3',
  format: 'image/png',
  transparent: true,
  version: '1.3.0',
};

const EUHydroLayer = L.tileLayer(EUHydroURL, wmsOptions).addTo(map);

console.log(EUHydroLayer);

I am new to these tools so I probably have errors in my request’s parameters.

I have tried appending service=WMS&request=GetCapabilities&version=1.3.0 to the end of the URL.

I have also tried setting up a CRS to the map with crs: L.CRS.EPSG4326 in mapOptions and wmsOptions.

As a side note, I intend to display all layers in my map, but I am just using one layer for now for testing purposes. I found the layers names from the GetCapabilities document.

1
  • What URL is being used, check your network tab in the browser debugger, does it return an image or an error message
    – Ian Turton
    Commented Mar 27 at 9:37

1 Answer 1

4

Since layer you are trying to show is not a tile layer but WMS layer, you have to use L.tileLayer.wms layer to show it. Since it has a lot of layers that are shown at different zooms, one possible strategy is to request all the layers.

This code:

var tileLayer = L.tileLayer('https://gisco-services.ec.europa.eu/maps/tiles/OSMPositronComposite/EPSG3857/{z}/{x}/{y}.png');

var wmsLayer = L.tileLayer.wms("https://image.discomap.eea.europa.eu/arcgis/services/EUHydro/EUHydro_RiverNetworkDatabase/MapServer/WMSServer", {
    version: '1.3.0',
    layers: '0,1,2,3,4,5,6,7,8,9,10,11,12,13,14,15,16,17,18,19,20',
    format: 'image/png',
    transparent: true
});
        
var map = L.map('map', {
  center: [41, 14],
  zoom: 4,
  layers: [tileLayer, wmsLayer]
});

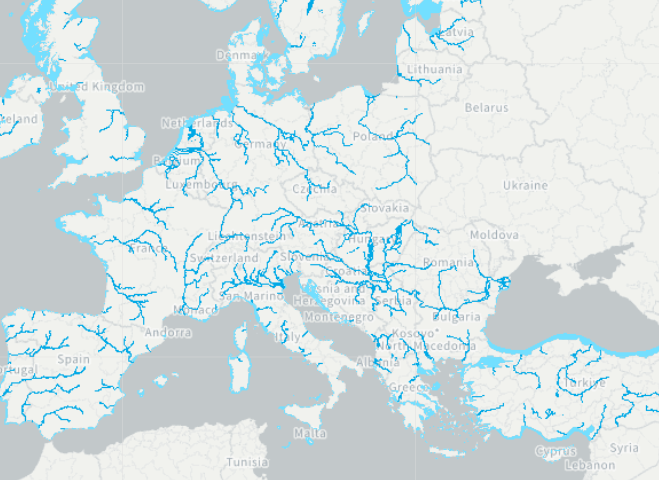
gives the follwing map at zoom 4:

enter image description here

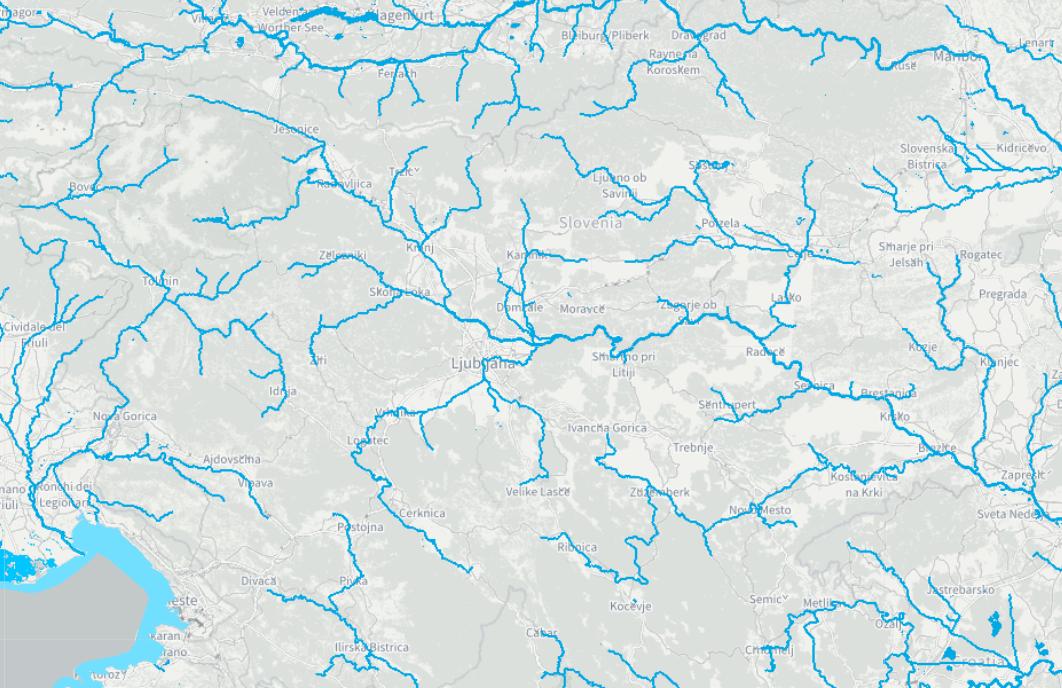
and this map at zoom 9:

enter image description here

1
  • Thank you, indeed I was missing the .wms subclass, embarrassing ! Thanks also for the advice and example on requesting all the layers.
    – tvoirand
    Commented Mar 27 at 10:36

Your Answer

By clicking “Post Your Answer”, you agree to our terms of service and acknowledge you have read our privacy policy.

Not the answer you're looking for? Browse other questions tagged or ask your own question.