28

I am looking for a way to simulate a gravity model using a point-based layer.

All my points are assigned a z-value and the higher this value, the larger is their "sphere of influence". This influence is inversely proportional to the distance to the center.

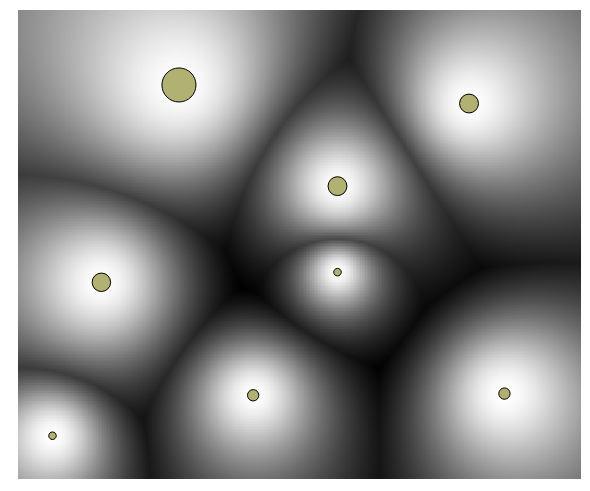
It is a typical Huff model, each point is a local maximum and valleys between them indicate the limits of the zone of influence between them.

I tried several algorithms from Arcgis (IDW, cost allocation, polynomial interpolation) and QGIS (heatmap plugin), but I found nothing that could help me. I also found this thread, but it isn't very helpful for me.

As an alternative, I could also be satisfied by an way to generate Voronoi diagrams if there is a way to influence the size of each cell by the z-value of the corresponding point.

1 Answer 1

13

Here's a little QGIS python function that implements this. It requires the rasterlang plugin (the repository has to be added to QGIS manually).

It expects three mandatory parameters: The points layer, a raster layer (to determine the size and resolution of the output), and a filename for the output layer. You can also provide an optional argument to determine the exponent of the distance decay function.

The weights for the points need to be in the first attribute column of the points layer.

The resulting raster is automatically added to the canvas.

Here's an example of how to run the script. The points have weights between 20 and 90, and the grid is 60 by 50 map units in size.

points = qgis.utils.iface.mapCanvas().layer(0)
raster = qgis.utils.iface.mapCanvas().layer(1)
huff(points,raster,"output.tiff",2)
from rasterlang.layers import layerAsArray
from rasterlang.layers import writeGeoTiff
import numpy as np

def huff(points, raster, outputfile, decay=1):
    if points.type() != QgsMapLayer.VectorLayer:
        print "Error: First argument is not a vector layer (but it has to be)"
        return
    if raster.type() != QgsMapLayer.RasterLayer:
        print "Error: Second argument is not a raster layer (but it has to be)"
        return
    b = layerAsArray(raster)
    e = raster.extent()
    provider = points.dataProvider()
    extent = [e.xMinimum(),e.yMinimum(),e.xMaximum(),e.yMaximum()]
    xcols = np.size(layerAsArray(raster),1)
    ycols = np.size(layerAsArray(raster),0)
    xvec = np.linspace(extent[0], extent[2], xcols, endpoint=False)
    xvec = xvec + (xvec[1]-xvec[0])/2
    yvec = np.linspace(extent[3], extent[1], ycols, endpoint=False)
    yvec = yvec + (yvec[1]-yvec[0])/2
    coordArray = np.meshgrid(xvec,yvec)
    gravity = b
    point = QgsFeature()
    provider.select( provider.attributeIndexes() )
    while provider.nextFeature(point):
      coord = point.geometry().asPoint()
      weight = point.attributeMap()[0].toFloat()[0]
      curGravity = weight * ( (coordArray[0]-coord[0])**2 + (coordArray[1]-coord[1])**2)**(-decay/2)
      gravity = np.dstack((gravity, curGravity))
    gravitySum = np.sum(gravity,2)
    huff = np.max(gravity,2)/gravitySum
    np.shape(huff) 
    writeGeoTiff(huff,extent,outputfile)
    rlayer = QgsRasterLayer(outputfile)
    QgsMapLayerRegistry.instance().addMapLayer(rlayer)
6
  • 3
    (+1) The approach looks good. But why do you take the square root and then re-square it in computing curGravity? That's a waste of computational time. Another wasted set of calculations involves normalizing all the "gravity" grids before finding the max: instead, find their max and normalize that by the sum.
    – whuber
    Commented Jan 29, 2013 at 18:02
  • Doesn't that square the whole fraction? Commented Jan 29, 2013 at 18:32
  • 1
    Jake, you still never need the square root: just forget about it altogether and use half the intended exponent. In other words, if z is the sum of squares of coordinate differences, instead of computing (sqrt(z))^p, which is two moderately expensive operations, just compute z^(p/2), which (because p/2 is a precomputed number) is just one raster operation--and leads to clearer code, too. This idea comes to fore when you apply gravitational models as they were originally intended: to travel times. There no longer is any square root formula, so you raise the travel time to the -p/2 power.
    – whuber
    Commented Jan 29, 2013 at 20:11
  • Thanks a lot, this looks like what I need. Just a problem, I am not so used to python and I never used Rasterlang extension. I Installed it on my QGIS version, but I am stuck with a "syntax error". Is your function already implemented in the rasterlang extension? If no, how do I do that? Thanks for you help! http://i.imgur.com/NhiAe9p.png
    – Damien
    Commented Jan 30, 2013 at 8:30
  • 1
    @Jake: Ok, I think I start understanding how the console works. I did as you said and the code seems to be understood properly. Now I have another error that relates to a python package "shape_base.py". Does my QGIS install lacks some features? http://i.imgur.com/TT0i2Cl.png
    – Damien
    Commented Jan 30, 2013 at 9:53

Your Answer

By clicking “Post Your Answer”, you agree to our terms of service and acknowledge you have read our privacy policy.

Not the answer you're looking for? Browse other questions tagged or ask your own question.