5

I am looking for a way to collect data on the height profile of some cities over time. I don't need to produce a detailed 3D reconstruction of cities, nor do I need to detect and measure individual buildings. I would simply need a coarse proxy of how "vertical" a city is - for instance, average building height, or maximum height.

I have in mind a few possible options but I'm not sure how involved they are and what kind of software can do this:

  • Look at the difference between a DSM and a DTM - I am still looking into possible sources (ASTER?)

  • LiDAR data

  • Stereo imagery (e.g. IKONOS)

  • Retrieving building height from shadows – I think even an ArcGis extension does this, but this is not automated and would require a building by building process.

I was told that software such as Socet Gxp, Leica LPS/XPro, and Pixel Factory can generate height data from satellite imagery automatically. Has anyone heard of those or know of any open source alternatives?

5
  • 1
    what kind of data you have?
    – rkm
    Commented Mar 17, 2013 at 4:11
  • How far back do you need to go? In some cities and boroughs, there are regulations on maximum height which can be tracked over time. Commented Mar 17, 2013 at 18:07
  • I am still in the process of collecting data. I wanted to have a sense of what data to look for.
    – Sheila
    Commented Mar 17, 2013 at 22:42
  • Deer Hunter, I think you are referring to Floor Area Ratios. This was actually my starting point! I am looking at Indian cities, and it turns out that information on FARs over time are very hard to collect!
    – Sheila
    Commented Mar 17, 2013 at 22:44
  • I'm having the same problem, trying to figure out how to get height values for buildings in a city but I'd need individual values in my case. However, without LIDAR as I couldn't find any such data for free.
    – Geosphere
    Commented Jan 5, 2015 at 12:32

2 Answers 2

2

Under the assumption that buildings are quite a bit higher than their surrounding environment, you could perform a cluster analysis on your height data. Depending on your data, this could lead to several clusters: high buildings, low buildings, surrounding landscape. There are some issues, for example, a high tree might be just as high as a low building.

Alternatively, you could perform some kind of (un)supervised classification in which you could use the height information and possibly other source of information such as not only the height information at the current location, but also the surrounding height.

Once you've determined which area of the map could be classified as city, or urban area, you could provide statistics such as mean and variance to describe the height and variations in the height.

Which analysis works well also depends on which data you are going to use. Very high resolution LIDAR data supports other analysis than very coarse SRTM images. Also take care that some height products have compensated for buildings as they where not interested in them.

Then there is the question of how to do this kind of analysis. I use R and other high level programming languages to do this. These tools have a steep learning curve, but provide ultimate flexibility. I don't use GUI tools such as ArcGIS, so I'm not up to speed how these support the kind of analyses I suggested. You could also take a look at QGis, GRASS, or SAGA. These are open source (and free) GIS tools.

3
  • Thanks! Unfortunately I have minimal knowledge of R for GIS purposes...I would appreaciate any other comments from ArcGis users.
    – Sheila
    Commented Mar 17, 2013 at 14:43
  • I just thought again about your answer. When you talk about cluster analysis you are thinking of just using a DSM without subtracting it a DTM?
    – Sheila
    Commented Mar 17, 2013 at 17:02
  • You could look at both situations, but if you have a DSM (Digital Surface Model?) and a DTM (Digital Terrain Model?) you should definitely exploit that. Commented Mar 17, 2013 at 17:48
1

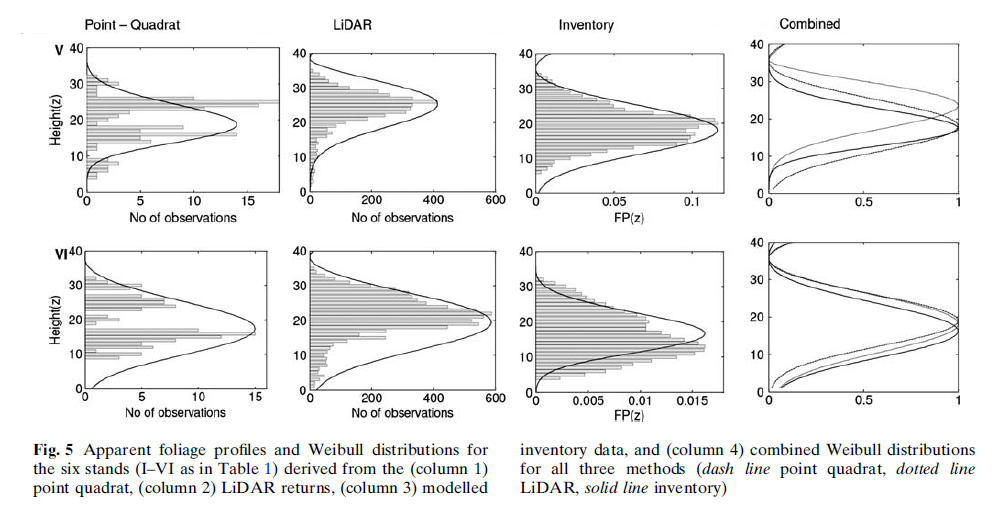
Histograms (or probability density functions) derived from LiDAR height observations would provide a nice summary of the city's vertical profile.

One example, regarding forest vertical profiles is Coops et al. (2007). Two of them derived from LiDAR data are shown in the second column, below:

enter image description here

Starting from a LiDAR point cloud, the main steps for retrieving such vertical profiles would be:

  • Generate a DEM, based on the ground points.
  • Use the DEM to normalize the point cloud, i.e., bring all points to the same ground reference, so, converting elevation in height.
  • Plot the histogram of heights (the empirical distribution) per city, per time; and compare them.
  • Or check if the data follow any theoretical distribution, if they do, model the data with such distribution (per city, per time), and compare the distributions by means of their parameters, or other type of statistics. Here is one example with the Weibull distribution.

Reference

COOPS, N. C. et al. Estimating canopy structure of Douglas-fir forest stands from discrete-return LiDAR. Trees, v. 21, n. 3, p. 295–310, 12 jan. 2007.

1
  • Sorry for the late reply! I haven't been able to retrieve LiDAR data as they are not free... Will keep looking!
    – Sheila
    Commented Apr 30, 2013 at 17:07

Your Answer

By clicking “Post Your Answer”, you agree to our terms of service and acknowledge you have read our privacy policy.

Not the answer you're looking for? Browse other questions tagged or ask your own question.