2

I'm trying use R for create a fishnet grid like in arcGIS with many cells of same size.

In the arcGIS 9.3 we have the option of create a polygon with many small square polygons (eg. 1 x 1 degree of lat and long) in the extent of our study area using the tool 'create fishnet' (http://webhelp.esri.com/arcgisdesktop/9.3/index.cfm?TopicName=Create_Fishnet_(Data_Management)) and after aply the tool 'Feature to Polygon' to transform the polygon lines in square polygons. Other option is use the “Hawth’s Tools” extension and acess the “Sampling Tools” -> “Create Vector Grid (line/polygon) but the extension only work properly until arcGIS 9.2.

Then I want create the fishnet grid (polygon with many regular squares) and after calculate many percentage of overlap of some polygons to each cell of the fishnet and create a matrix with each cell in lines and each polygon in the columns, like this matrix.

2
  • What's a 'fishnet grid'? Is it lines? Or small square polygons? Or a raster? What do you want to do with it when you've got it?
    – Spacedman
    Commented Apr 11, 2013 at 22:39
  • Sorry, I edited the post to be more clear. Thanks!
    – fvfaleiro
    Commented Apr 12, 2013 at 13:38

4 Answers 4

3

If you mean by fishnet grid a regular spatial grid, there are several options available in R:

  • Simply use a matrix.
  • Use the SpatialGrid/Pixels classes from the sp package
  • Use the raster format from the raster package.

A good overview of spatial packages in R is given on the CRAN Spatial Task View.

1

The sp package in R might be a good place to start. A quick browse through the pdf manual shows that there are functions with names such as gridlines that might be useful to you.

0

a good and fast way to start is to create your fishnet using the raster package to create your grid as a raster and then transform it into a polygon.

library(raster)
fishnet <- raster() # this creates a raster with the extent of the whole world.
res(fishnet) <- .5  # sets the resolution of your grid -- here .5 x .5 degrees
crs(fishnet) <- CRS("+proj=longlat +ellps=WGS84 +datum=WGS84") # set projection
fishnet <- rasterToPolygons(fishnet) # transform into a polygon
fishnet@data <- data.frame(id = 1:nrow(fishnet)) # assigning some data

then you might select the polygons (cells) which overlap with your other polygon with

fishnet <- fishnet[!is.na(over(fishnet, polygon))[,1],]

finally, to calculate the percentage of the area that the polygon covers of each cell, you might try using brute force and loop over all your cells to calculate the relative area of the intersection of each cell with your polygon. I propose the package rgeos for the task

library(rgeos)
for (i in 1:nrow(fishnet)) {
  fishnet[i,]$share <- gArea(gIntersects(polygon, fishnet[i,]))/gArea(fishnet[i,])
}
1
  • Bruno Conte Leite, thanks for contribute, but your example did not works for me. I posted a solution really simple, but you could try use my "spdf" object example to try apply in your solution and fix it. I think it will be good to explore other options.
    – fvfaleiro
    Commented Apr 9, 2019 at 20:23
0

I found a really simple and good solution with the rasterize function from raster package

library(raster)
library(sp)

Create polygons

x_coord <- c(0,  1,  6, 4, 2)
y_coord <- c(10, 5, 5, 12, 10)
xym <- cbind(x_coord, y_coord)
p1 = Polygon(xym)
p2 = Polygon(xym - 3)
ps1 = Polygons(list(p1), 1)
ps2 = Polygons(list(p2), 2)
sps = SpatialPolygons(list(ps1, ps2))
proj4string(sps) = CRS("+proj=longlat +datum=WGS84 +no_defs +ellps=WGS84 +towgs84=0,0,0")

Create a SpatialPolygonsDataFrame

spdf = SpatialPolygonsDataFrame(sps, data.frame(col1 = 1:2))

Create a raster of the study area

fishnet.r <- raster(extent(spdf)+5)
res(fishnet.r) <- 2
proj4string(fishnet.r) <- CRS("+proj=longlat +datum=WGS84 +no_defs +ellps=WGS84 +towgs84=0,0,0")

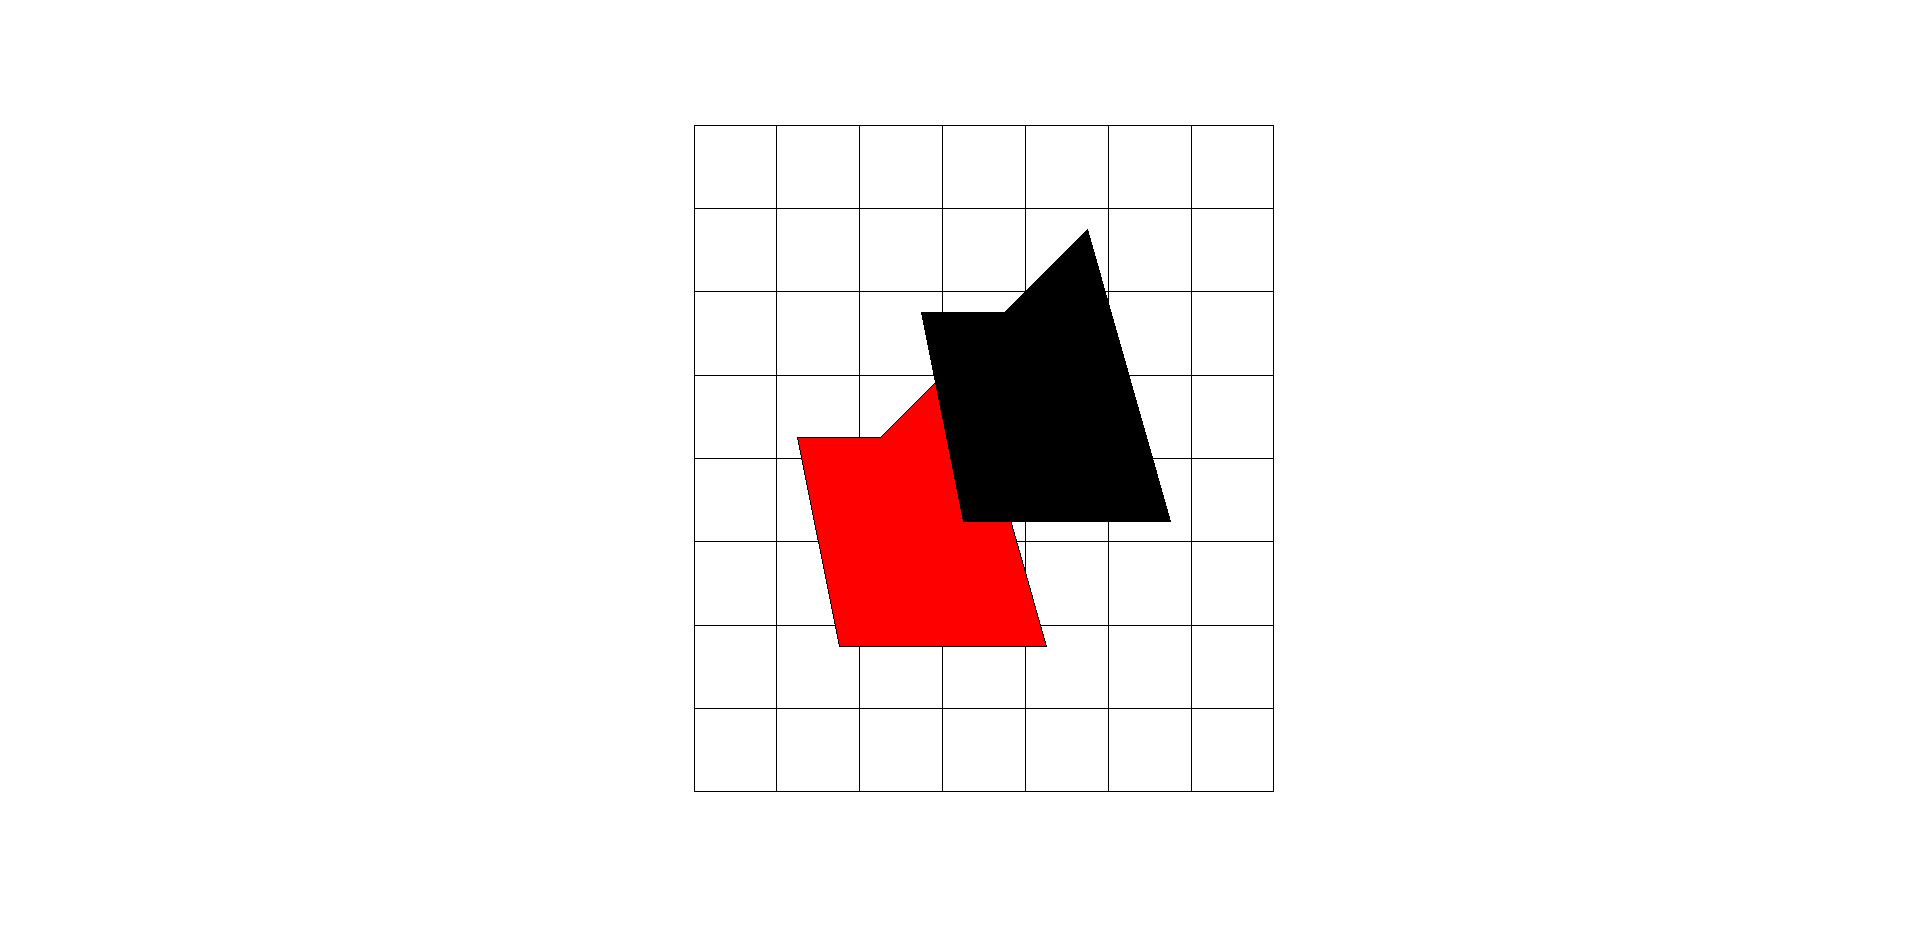
check the inputs

fishnet <- rasterToPolygons(fishnet.r)
plot(fishnet)
plot(spdf, col = 1:2, add = T)

enter image description here

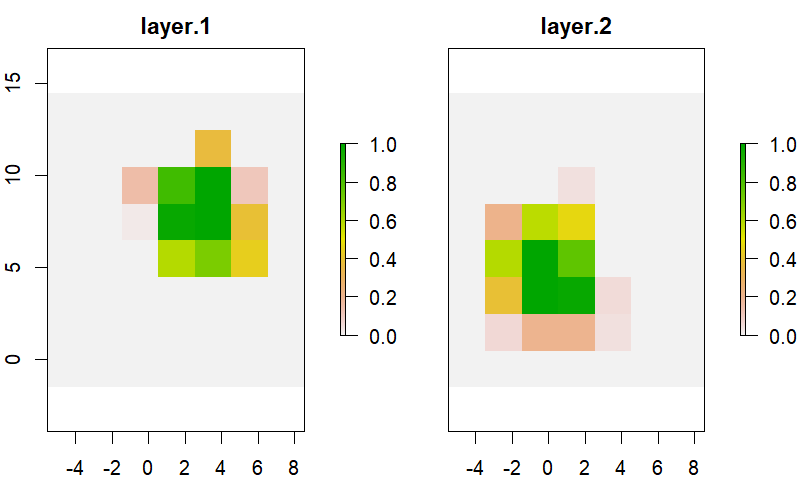
Get the percentage cover of polygons for all cells

l <- vector('list', length(spdf))
for(i in 1:length(spdf)) {
  l[[i]] <- rasterize(spdf[i, ], fishnet.r, getCover = TRUE)
}
b <- brick(l)
plot(b)

enter image description here

Get the percentage in matrix format

m.out <- as.matrix(b)

Transform from RasterBrick to polygon (fishnet)

fishnet.out <- rasterToPolygons(b)

Your Answer

By clicking “Post Your Answer”, you agree to our terms of service and acknowledge you have read our privacy policy.

Not the answer you're looking for? Browse other questions tagged or ask your own question.