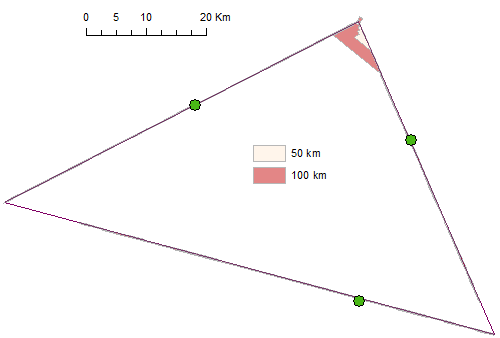
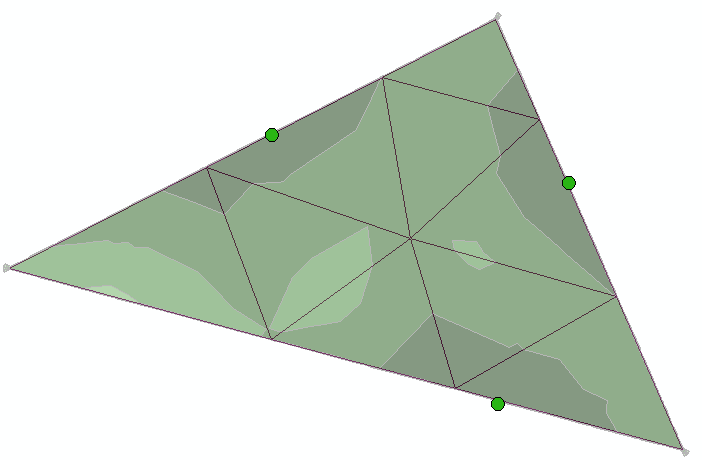
At the bottom of the help page on service area analysis that PolyGeo links to, there is a link to another help page: Algorithms used by the ArcGIS Network Analyst extension. From that help page:
The Service Area solver is also based on Dijkstra's algorithm to
traverse the network. Its goal is to return a subset of connected edge
features such that they are within the specified network distance or
cost cutoff; in addition, it can return the lines categorized by a set
of break values that an edge may fall within. The service area solver
can generate lines, polygons surrounding these lines, or both.
The polygons are generated by putting the geometry of the lines
traversed by the Service Area solver into a triangulated irregular
network (TIN) data structure. The network distance along the lines
serves as the height of the locations inside the TIN. Locations not
traversed by the service area are put in with a much larger height
value. A polygon generation routine is used with this TIN to carve out
regions encompassing areas in between the specified break values. The
polygon generation algorithm has additional logic to produce the
generalized or detailed polygons and to deal with the many special
cases that can be encountered.
So in part hopefully that provides more information, and the other part is "it's proprietary" as PolyGeo said.
There are also several user options that go into polygon creation - trim or not (does not affect regions completely enclosed by network edges - see my related answer at this question), general or detailed polygons, etc. Some of the issues in your posted images and example may be related to the complexity of the network and how the points are associated with it - without seeing the network creation or analysis settings it is hard to comment.
The short version is that polygons are always going to be an interpretation of some sort, whereas line output will be a more true representation of the analysis results (as stated in the Service Area Analysis help file).


