5

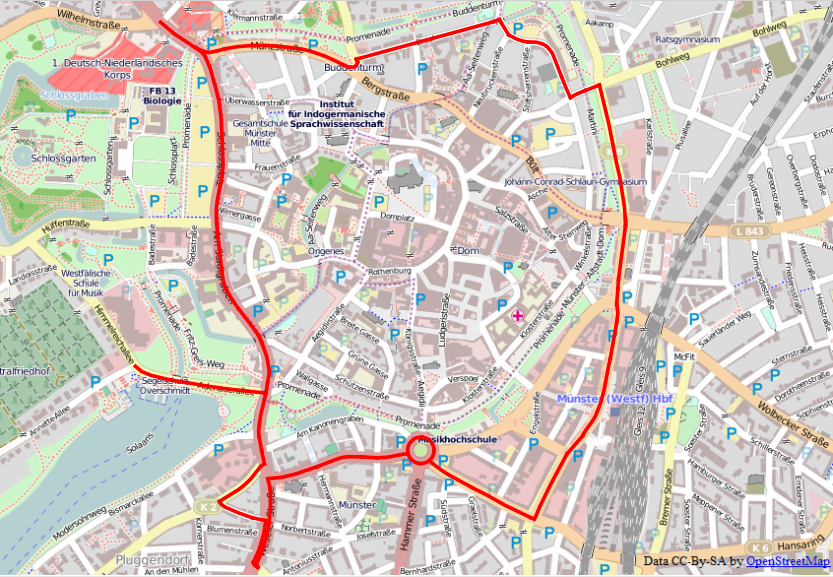
The following Points layer is the basis of a rendering in a Android application.
Points layer in QGIS

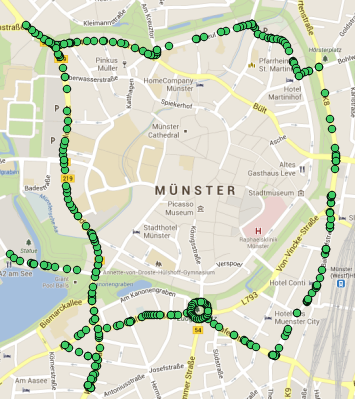
Android allows to draw a shape from the provided points. I cannot use LineStrings.
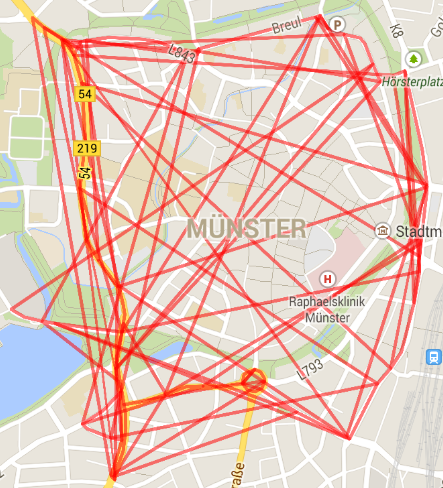
Points layer in Android

However, the order of points exported from QGIS seems to be odd.

Is there any way to visually sort the order of points in QGIS or using the GDAL tools? The order of feature ids in the final export format (such as CSV) needs to be kind of a roundtrip as visualized in the following picture. If there are multiple paths or a "hole" it is perfectly okay to have multiple point layers.
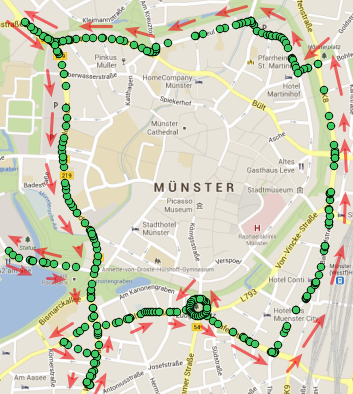
Points layer visualizing the roundtrip

Export experiments

I tried different steps to get hold of the latitude/longitude coordinates:

  1. QGIS: Export points layer as CSV, add layer create options: GEOMETRY=AS_YX
  2. Convert into Android specific format JSON format using regular expressions.

This has the disadvantage that the feature id is still included. The order of points however is not as desired.

  1. ogr2ogr -f CSV output.csv input.shp -lco GEOMETRY=AS_YX
  2. Convert into Android specific format JSON format using regular expressions.

Here the feature id is already omitted. The order of points however is not as desired.

  1. QGIS: Export points layer as GML
  2. ogr2ogr -f "CSV" -select "" output.csv input.gml -lco "GEOMETRY=AS_YX"
  3. Convert into Android specific format JSON format using regular expressions.

The order of points however is not as desired. The order of points is different to what the former exports/conversions output.


The original layer is also available as a LineString layer.

4
  • How did you obtain points layer? What should be the result? Commented Dec 7, 2013 at 13:33
  • @zimmi The point layer is a export from OpenStreetMap and the result in Android should be a clean path (like a oval shape).
    – JJD
    Commented Dec 7, 2013 at 20:25
  • So you actually want to go through points one by another and connect them with a line. Is there any incrementing id associated with them that would help you tell what the previous and the next point should be? Commented Dec 7, 2013 at 21:30
  • @zimmi Please note that I uploaded the files - the link is at the beginning of the post. The ids are not unique. The original dataset is a LineStrings visualization of multiple parts. I would like to avoid manually drawing the path since I have to do the same for various layers.
    – JJD
    Commented Dec 7, 2013 at 22:37

3 Answers 3

3

Because the points for each id are already sorted, you can solve with:

ogr2ogr -dialect SQLite -sql "SELECT MakeLine(geometry), id FROM Muenster GROUP BY id" Muenster_lines.shp Muenster.shp

Then you can easily join the single lines and obtain the result path, as shown below:

enter image description here

EDIT

I think that it's not possible to sort all the points without defining a route based on a network topology. At the moment, you can only "order" the points with the same id calculating their FID, a special field of OGR SQL. For instance:

ogr2ogr -where "id='5967589'" Muenster_5967589.shp Muenster.shp
ogr2ogr -f CSV -sql "SELECT FID FROM Muenster_5967589" -lco GEOMETRY=AS_XY Muenster_5967589.csv Muenster_5967589.shp

This is the content of Muenster_5967589.csv:

X,Y,FID,
7.6175577,51.9619021,0
7.617543,51.9620712,1
7.617544,51.9623006,2
7.617577,51.9624964,3
7.6176213,51.9626584,4
7.6177773,51.9631274,5
7.617828,51.9634665,6
7.6178088,51.9638744,7
7.6177495,51.9647474,8
7.6176424,51.9652417,9
2
  • Agreed, the shape looks good in QGIS. But as stated here I need to export the points (latitude, longitude) in the correct order into a CSV file in order to process them in Android.
    – JJD
    Commented Dec 8, 2013 at 12:04
  • It seems that you have to solve a Traveling salesman problem before ordering all the points. Commented Dec 9, 2013 at 19:41
2

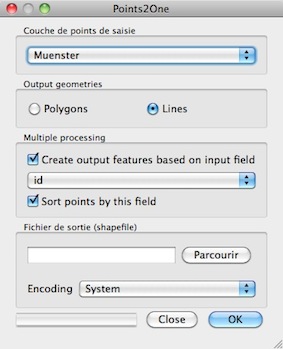
The same result is achieved with the Point2One plugin (and you can sort the points)

enter image description here

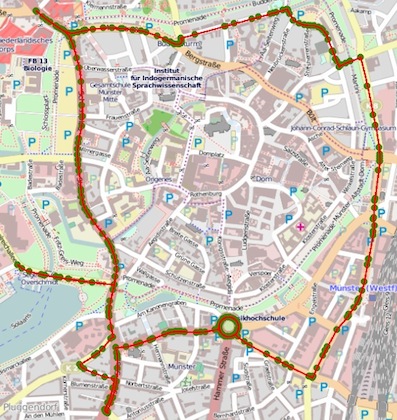
Result:

enter image description here

7
  • But key to the problem is that the order of ids does not necessarily match with the visual order I want to achieve for the roundtrip drawing I require for Android. I tried your approach but it still looks like a spiderweb in Android.
    – JJD
    Commented Dec 9, 2013 at 13:12
  • What is your visual order based on ?
    – gene
    Commented Dec 9, 2013 at 14:40
  • I updated my question to make it more clear, hopefully. I do not care about the starting point but I depend on the correct "roundtrip" order reflected by the order of coordinates in a export format such as CSV.
    – JJD
    Commented Dec 9, 2013 at 15:03
  • 2
    You need Graph Theory traversal algorithms or Networks algorithms (look at Euclidean minimum spanning tree, for example).
    – gene
    Commented Dec 9, 2013 at 15:59
  • 1
    The Line Strings are not ordered, and do not have the same orientation. If they can be connected (not as MutliLine) the point export is correct. That's the fun part of working with Openstreetmap data :-)
    – AndreJ
    Commented Dec 9, 2013 at 19:22
1

I tried this in QGIS:

  1. Load the polyline data from OSM
  2. Reproject it to UTM 32N
  3. Vector -> Geoprocessing -> Buffer with a value of 10 (metres) for Buffer distance.
  4. Vector -> Geoprocessing -> Dissolve using dissolve all will lead to one polygon
  5. Vector -> Geometry Tools -> Multipart to single part creates one polygon for every LEZ with a hole in the middle
  6. Vector -> Geometry Tools -> Polygons to Lines
  7. Vector -> Geometry Tools -> Lines to Polygons
  8. Vector -> Geoprocessing -> Dissolve using dissolve all will remove the inner ring
  9. Vector -> Geometry Tools -> Multipart to single part creates one polygon for every LEZ without hole
  10. Using Field Calculator, create unique ids with a new field filled with $id
  11. Install the MMQGIS plugin
  12. MMQGIS -> Import/Export -> Geometry Export to CSV

For checking:

  • Import as Delimited text layer
  • Install Points2One plugin
  • Join the points to a line with Points2One

This works for Münster, but may fail on other cities (like Frankfurt, where a segment of the border is missing).

7
  • Can you please confirm I am doing the following steps correct? Step 2: I choose Set Layer CRS and select WGS 84 / UTM zone 32N. Can you explain why I have to reproject the layer? Step 3: When I process the layer this results in a egg-shaped thing for Muenster.
    – JJD
    Commented Dec 9, 2013 at 13:10
  • 1
    No, you have to Rightclick -> Save As .... Set CRS will not reproject the coordinates. OSM data is in degrees, and you don't want a 10 degrees buffer (That's your eggshape). Choosing a small degree value is also possible.
    – AndreJ
    Commented Dec 9, 2013 at 14:25
  • After Step 9 the Attributes Table contains one row: |4064462|Moltkestraße|. Can you confirm this?
    – JJD
    Commented Dec 9, 2013 at 15:00
  • Yes, could be. I did it with all type=LEZ relations. With only one LEZ, you can leave out step 9.
    – AndreJ
    Commented Dec 9, 2013 at 15:34
  • The Attributes Table contains many rows after Step 3 and after Step 4 one is remaining. Seems as if I am doing something wrong. - The polyline data in Step 1 is retrieved using OpenStreetMap Vector commands as described in the beginning of your post, correct?
    – JJD
    Commented Dec 9, 2013 at 16:20

Your Answer

By clicking “Post Your Answer”, you agree to our terms of service and acknowledge you have read our privacy policy.

Not the answer you're looking for? Browse other questions tagged or ask your own question.