2

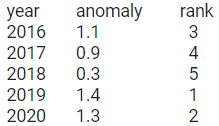
I am trying to rank the temperature anomalies in a time series. Basically, I would like to have a raster showing the position of year X (eg 2020) in a time series (eg first hottest (value=1), second hottest (value=2), 15th hottest,...). Let me try to explain better with an example. For a pixel I have the following anomalies for the last 5 years. Then the anomalies have been ranked (2019 is the hottest 'largest anomaly', 2020 is the second hottest,...)

enter image description here

I would like to produce a layer for the year 2020 where my pixel has the value 2 (rank) I have been able to produce a raster showing the hottest year in a TS but do not know how to produce the annual ranked value

This is how far I managed to get - it's just getting the year of the max anomaly:

var startYear = 1981
var endYear = 2020

// Dummy collection of anomalies to have shortest possible code to reproduce my question
var anom = ee.ImageCollection(
  ee.List.sequence(startYear, endYear)
    .map(function (year) {
      year = ee.Number(year)
      return ee.Image([
        ee.Image.random(year).multiply(10000).int16().rename('anom'),
        ee.Image(year).int16().rename('year')
      ]).set('year', year)
    })
)
print(anom, 'anomalies')

var ROI = Map.getBounds(true)
var YYmax = anom.qualityMosaic('anom')
print(YYmax, 'YYmax')
Map.addLayer(YYmax.clip(ROI), {
  bands: 'year',
  min: startYear,
  max: endYear,
  palette: ["LemonChiffon", "Gold", "Orange", "Red", "Maroon"]
}, 'YYmax')

https://code.earthengine.google.com/dd0447086b40fd85453c963b7ff9e50d

Here is my complete code https://code.earthengine.google.com/ea25c30f8724851e6ab0e946d8ed9e41

Can anybody help?

1
  • Welcome to GIS SE! We're a little different from other sites. We're a Q&A site, not a discussion forum. For questions that involve code we ask that you show us where you are stuck with your own code by including a code snippet in your question. There is an edit button beneath your question which will enable you to do that and a {} button that enables you to format any highlighted code nicely. Please check out our short tour for more about how the site works. Thanks.
    – PolyGeo
    Commented Dec 2, 2021 at 8:58

1 Answer 1

1

You can do this with some array image fiddling. That's always a bit tricky, and not very easy on the eyes. To understand the code in detail, I suggest that you add the intermediate array images to the map and inspect, to see what they contain.

var anomYearArray = anom
  .toArray() // Convert collection to 2D array image 
var anomArray = anomYearArray.arraySlice(1, 0, 1)
var anomYearSorted = anomYearArray
  .arraySort(anomArray) // Sort by anomaly
  
var rankArray = anomArray.not().not() // An array of 1
      .arrayAccum(0, ee.Reducer.sum()) // An array from 1 to number of anomalies
      .multiply(-1).add(anomArray.arrayLength(0)).add(1) // Reverse array
var anomYearRankArray = anomYearSorted.arrayCat(rankArray, 1)

var rankedAnom = ee.ImageCollection(
  ee.List.sequence(startYear, endYear)
    .map(function (year) {
      year = ee.Number(year)
      var yearMask = anomYearRankArray.arraySlice(1, 1, 2).eq(year)
      var yearImage = anomYearRankArray.arrayMask(yearMask)
        .arrayProject([1])
        .arrayFlatten([['anom', 'year', 'rank']])
        .set('year', year)
        .set('system:time_start', ee.Date.fromYMD(year, 1, 1))
      return yearImage
    })
)

var anom2020 = rankedAnom.filterMetadata('year', 'equals', 2020)
Map.addLayer(anom2020, {bands: 'rank', min: 1, max: endYear - startYear + 1}, 'rank 2020')

https://code.earthengine.google.com/6f3f70cec94d1541f4ef3cbb01327d79

Here it is plugged into your complete script: https://code.earthengine.google.com/6ca7568d2d1ceb0f90561af41aa7738a

1
  • Hi Daniel, it works like a charm..... a great solution. Many thanks for your support
    – gianca
    Commented Dec 3, 2021 at 15:44

Your Answer

By clicking “Post Your Answer”, you agree to our terms of service and acknowledge you have read our privacy policy.

Not the answer you're looking for? Browse other questions tagged or ask your own question.