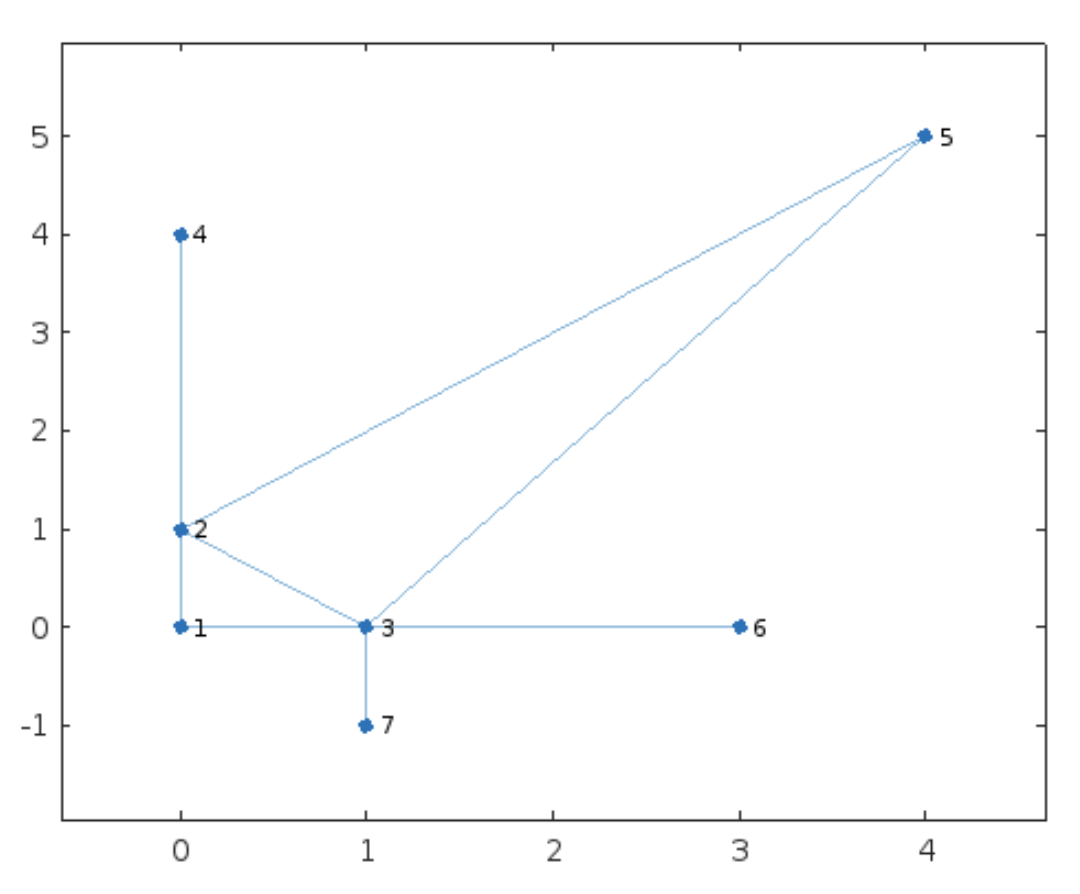
I have a graph composed of nodes and edges (this is in Matlab just to show something, but it can be done with other languages!)
s = [1 1 2 2 2 3 3 3];
t = [2 3 3 4 5 6 7 5];
x = [0 0 1 0 4 3 1];
y = [0 1 0 4 5 0 -1];
G = graph(s,t);
G.Nodes.X = x'; G.Nodes.Y = y';
plot(G,'XData',G.Nodes.X,'YData',G.Nodes.Y)
Just to be more clear, see here below the lists of edges and nodes:
>> G.Edges

ans =

  8×1 table

    EndNodes
    ________

     1    2
     1    3
     2    3
     2    4
     2    5
     3    5
     3    6
     3    7

>> G.Nodes

ans =

  7×2 table

    X    Y
    _    __

    0     0
    0     1
    1     0
    0     4
    4     5
    3     0
    1    -1
Now my question:
How can transform these two lists of edges and nodes into a JSON or GeoJSON or shapefile, that can be read by QGIS?
I would like to see the same graph I have plotted here inside QGIS.


