2

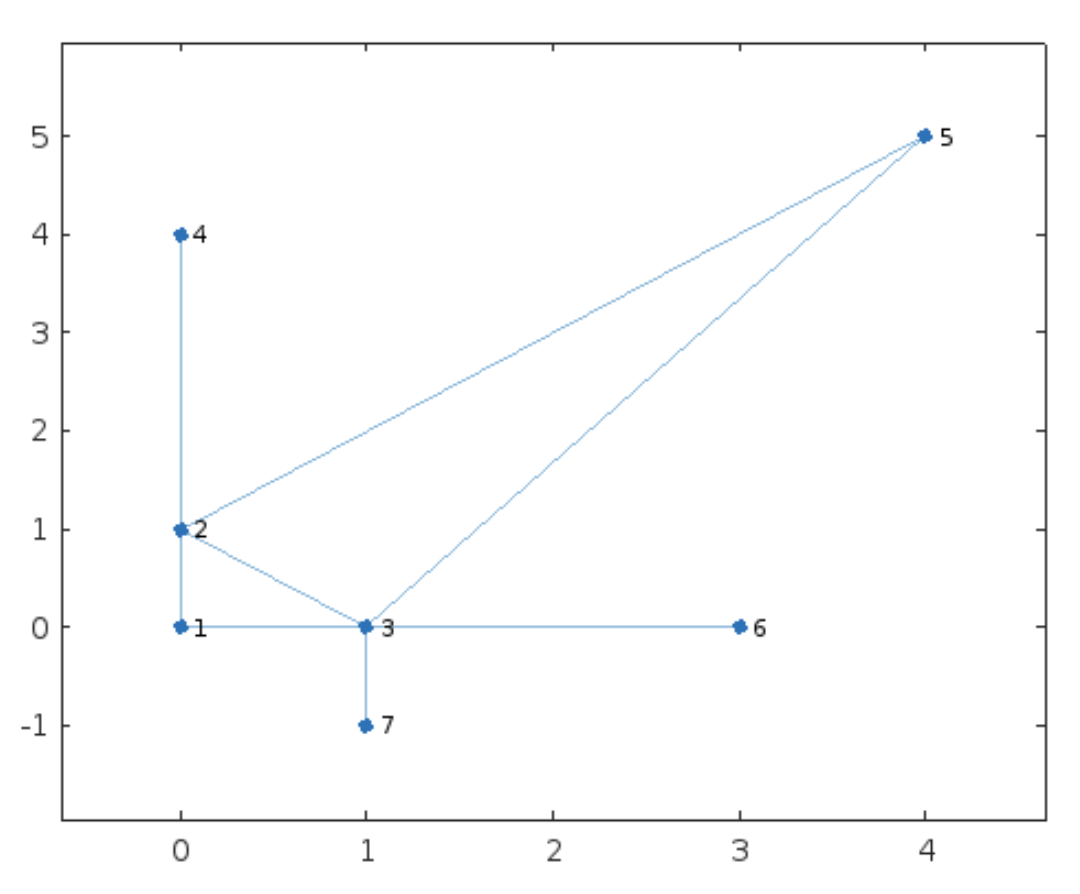
I have a graph composed of nodes and edges (this is in Matlab just to show something, but it can be done with other languages!)

s = [1 1 2 2 2 3 3 3];
t = [2 3 3 4 5 6 7 5];
x = [0 0 1 0 4 3 1];
y = [0 1 0 4 5 0 -1];
G = graph(s,t);
G.Nodes.X = x'; G.Nodes.Y = y';
plot(G,'XData',G.Nodes.X,'YData',G.Nodes.Y)

enter image description here

Just to be more clear, see here below the lists of edges and nodes:

>> G.Edges

ans =

  8×1 table

    EndNodes
    ________

     1    2 
     1    3 
     2    3 
     2    4 
     2    5 
     3    5 
     3    6 
     3    7 

>> G.Nodes

ans =

  7×2 table

    X    Y 
    _    __

    0     0
    0     1
    1     0
    0     4
    4     5
    3     0
    1    -1

Now my question:

How can transform these two lists of edges and nodes into a JSON or GeoJSON or shapefile, that can be read by QGIS?

I would like to see the same graph I have plotted here inside QGIS.

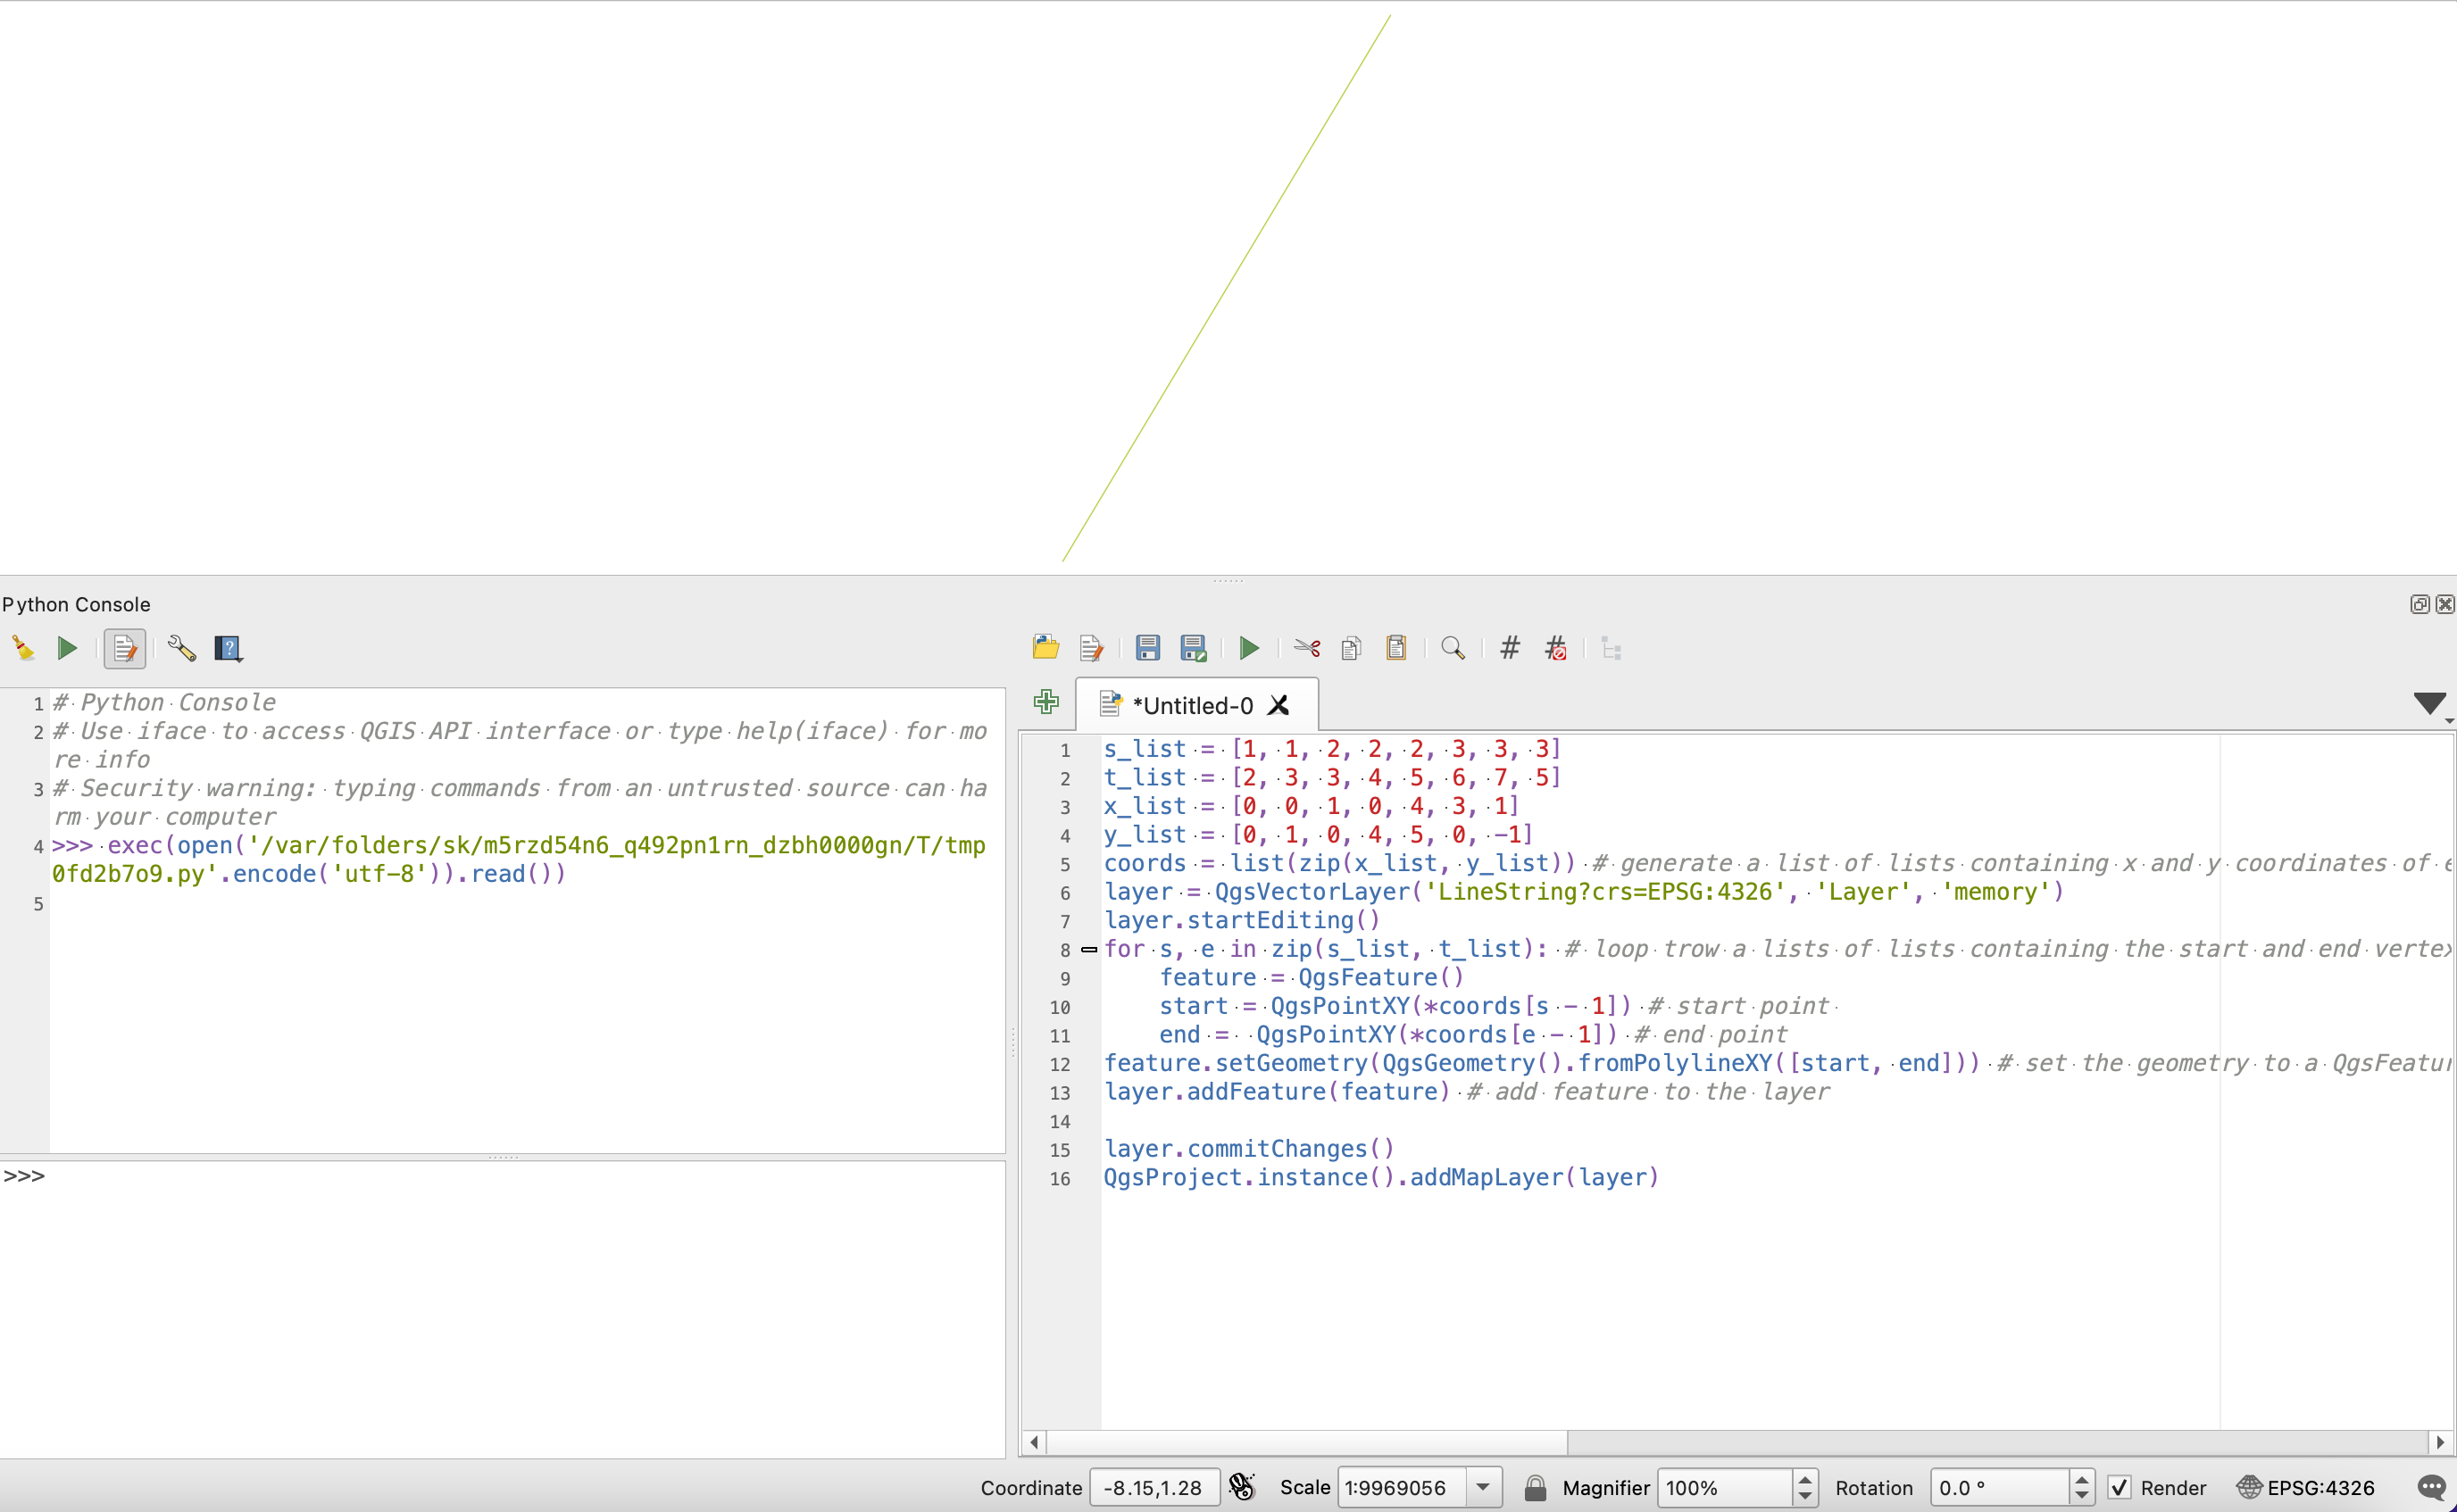
@Mayo: Your solution just shows one edge in my machine: enter image description here

4
  • 1
    Would ascii WKT polygon format be useful? gis.stackexchange.com/questions/202770/…
    – Hans Erren
    Commented Jul 6, 2022 at 15:52
  • 1
    And where do you have stored the edges and nodes tables?
    – Mayo
    Commented Jul 6, 2022 at 16:07
  • @HansErren thanks a lot, but I am not sure it can be useful... sorry.... :-)
    – Ommo
    Commented Jul 6, 2022 at 16:12
  • They can be stored in any traditional file format....csv, txt, etc.. :)
    – Ommo
    Commented Jul 6, 2022 at 16:13

1 Answer 1

3

Try this in the QGIS python console

s_list = [1, 1, 2, 2, 2, 3, 3, 3]
t_list = [2, 3, 3, 4, 5, 6, 7, 5]
x_list = [0, 0, 1, 0, 4, 3, 1]
y_list = [0, 1, 0, 4, 5, 0, -1]
coords = list(zip(x_list, y_list)) # generate a list of lists containing x and y coordinates of every vertex
layer = QgsVectorLayer('LineString?crs=EPSG:4326', 'Layer', 'memory')
layer.startEditing()
for s, e in zip(s_list, t_list): # loop trow a lists of lists containing the start and end vertex index in the coords list 
    feature = QgsFeature()
    start = QgsPointXY(*coords[s - 1]) # start point 
    end =  QgsPointXY(*coords[e - 1]) # end point
    feature.setGeometry(QgsGeometry().fromPolylineXY([start, end])) # set the geometry to a QgsFeature object
    layer.addFeature(feature) # add feature to the layer
    
layer.commitChanges()
QgsProject.instance().addMapLayer(layer)

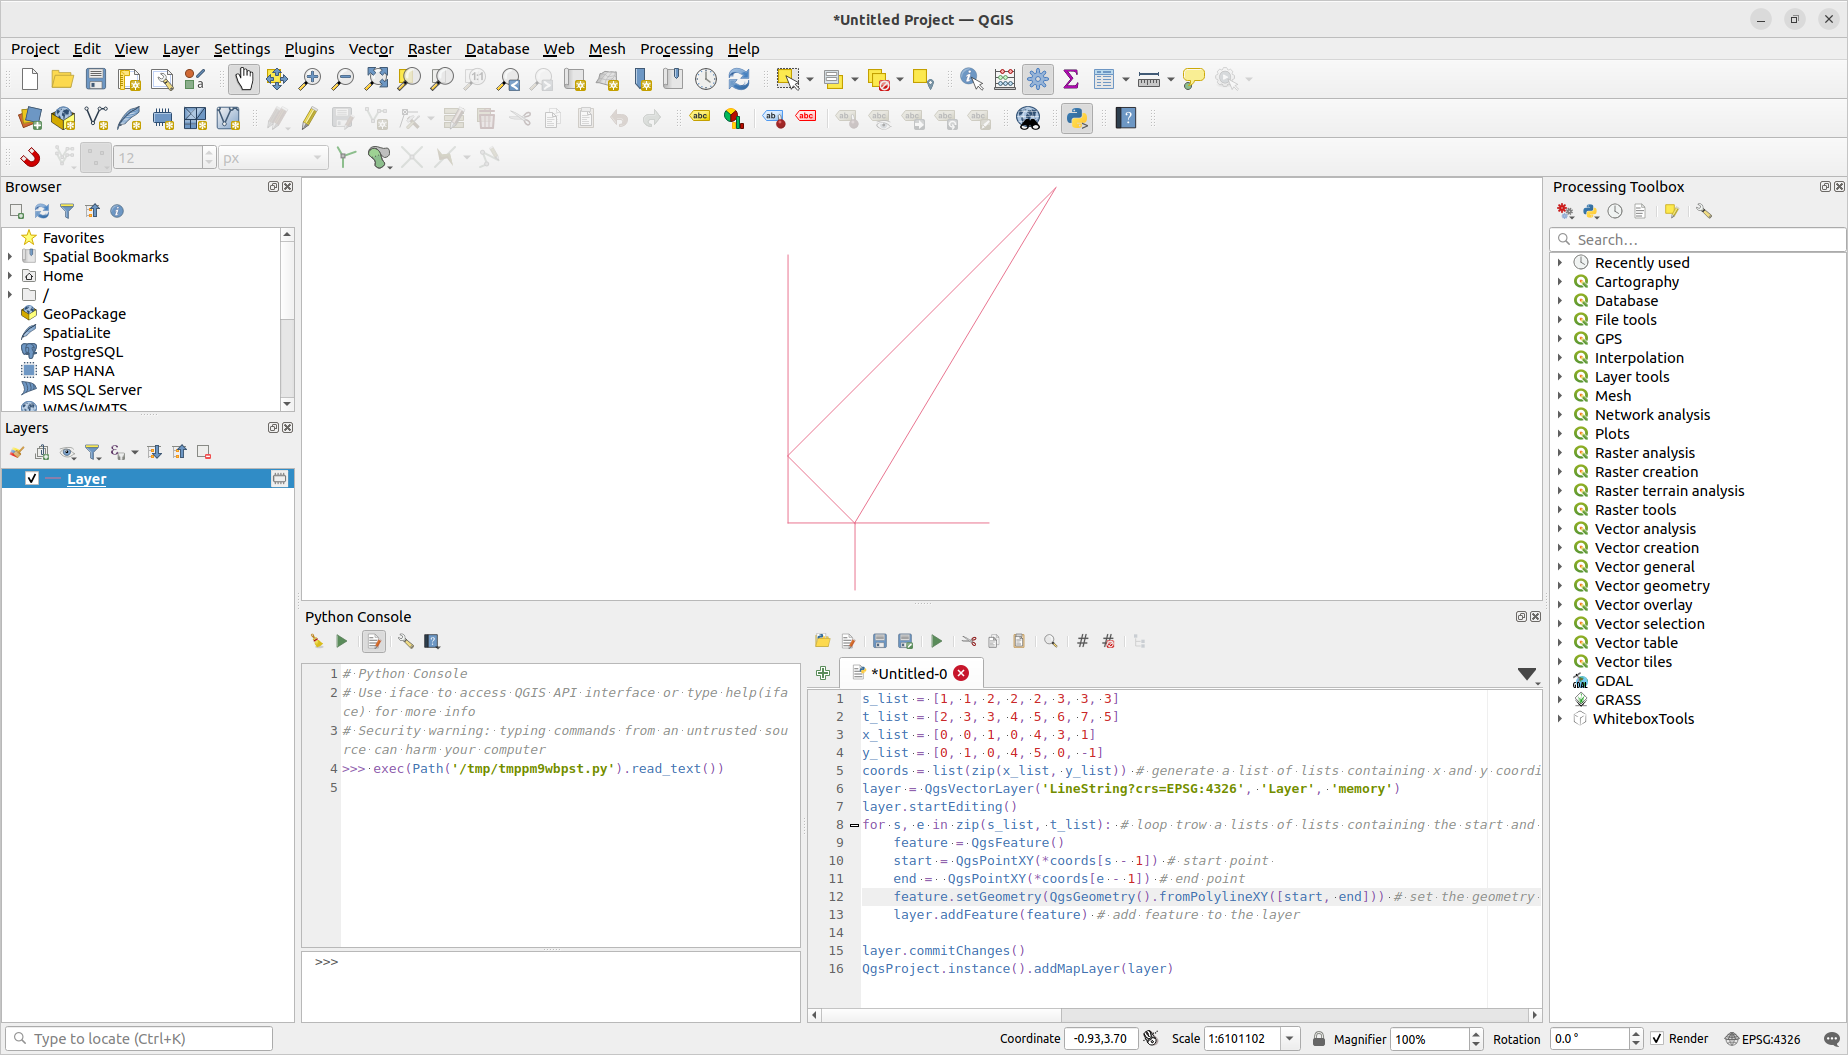
Result

To save this vector to a file add:

QgsVectorFileWriter.writeAsVectorFormat(
    layer,
    'path/to/your/file.shp', # set here the path to your file including the file extension
    "utf-8", # file encoding
    QgsCoordinateReferenceSystem("EPSG:4326"), # set inside quotes the crs id
    "ESRI Shapefile" # set here the vector driver
    )

available vector drivers here

6
  • Wowwwww!!!! Thanks a lot! - but instead of memory is it possible to have ESRI Shapefile ?
    – Ommo
    Commented Jul 6, 2022 at 16:36
  • Your solution just shows one edge in my machine... Please see the picture in the question..
    – Ommo
    Commented Jul 8, 2022 at 8:03
  • 1
    I tested it and it looked like the picture one.
    – Mayo
    Commented Jul 8, 2022 at 12:00
  • 1
    Yes, it works well also for me, many thanks!!.. I do not know why the other day it was showing only one edge... just a small thing.... I had to shift a bit right (just a tab) the command feature.setGeometry(QgsGeometry().fromPolylineXY([start, end])) , otherwise I was getting an error unexpected indent :-)
    – Ommo
    Commented Jul 11, 2022 at 8:31
  • 1
    Thank you, I already edit my answer with your suggestion.
    – Mayo
    Commented Jul 11, 2022 at 13:37

Your Answer

By clicking “Post Your Answer”, you agree to our terms of service and acknowledge you have read our privacy policy.

Not the answer you're looking for? Browse other questions tagged or ask your own question.